
How Transfer Servers Handle Load: Connections, Workers, and the Four Resources That Run Out
Every transfer server has a bad night eventually. Partners complain that uploads crawl, a few get refused outright, and the dashboard shows the CPU idling at thirty percent while everything feels stuck. The admin on call restarts the service, which helps for ten minutes, and the next morning nobody can say what actually ran out. A transfer server under load is not mysterious. But it is easy to misread if you do not know what a connection costs and which resource fills up first.
This article is the foundation for the rest of our Capacity & Concurrency series. It explains the difference between a connection, a session, and a transfer. It explains how a server serves hundreds of clients at once. It covers what each client costs in memory, CPU, disk, and network, and how to tell which of those four is about to give out. By the end you will be able to read the operating system's own counters and say, with evidence, "the disk is saturated, not the CPU." That is the sentence that turns a restart-and-hope night into a fix.
Connections, Sessions, and Transfers Are Three Different Things
People use these three words interchangeably, and that is where most capacity confusion starts. They describe three layers of activity, and each costs the server something different.
A connection is a single open TCP conversation between a port on the client and a port on the server. It is the lowest-level unit: the operating system and the firewall both track it, and it exists whether or not anything useful is happening over it.
A session is a logged-in user's stay on the server, from successful authentication to logout or timeout. How many connections a session uses depends on the protocol. An SFTP session is one connection: everything, including file data, travels inside a single SSH connection. A plain FTP or FTPS session is one long-lived control connection plus a fresh data connection for every transfer or directory listing. So a busy FTP session may open and close dozens of connections.
A transfer is a file actually moving. This is the layer that costs disk and network bandwidth. A session can sit idle for an hour with no transfer running, holding a connection and a little memory but nothing else.
Concurrency means how many of something are happening at the same time, and it matters which layer you count. At a busy moment you might see 300 logged-in sessions of which 40 are transferring. Another 200 are between commands (a script deciding what to send next). And 60 are idle because a client forgot to disconnect. Only the 40 use disk and network. All 300 use memory and a slot against whatever connection limit is configured.
Remember: a connection costs memory and bookkeeping. A transfer costs disk and network. Encryption costs CPU on every byte of a transfer. When someone says "the server is under load," your first question should be: load of which kind?
How One Server Talks to Hundreds of Clients at Once
A server program has to work for many clients simultaneously, and there are two common ways to organize that. Knowing which your server uses matters because the model determines what a connection costs.
Thread-per-connection. A thread is a worker inside a single running program; all the threads share the program's memory but each runs its own sequence of instructions. Every time a client connects, the server starts a new thread for that client, and it lives until the client disconnects. Many Windows FTP and SFTP servers work this way. Each thread reserves a private stack plus the buffers the server allocates for that client. Three hundred connections means three hundred threads in one process.
Process-per-connection. A process is a whole separate running copy of the program with its own memory. OpenSSH, the SFTP server most Linux systems use, works this way. The listening daemon accepts a connection, then starts a new process for it. In fact, it starts a pair, because it separates the privileged and unprivileged parts of the session for security. It is the most isolated model and the most expensive per connection. You can watch it on a Linux SFTP server:
$ ps -C sshd --no-headers | wc -l
187
$ ps -C sshd -o pid,rss,args --sort=-rss | head -3
    PID   RSS COMMAND
  41822  9928 sshd: partner-acme [priv]
  41830  6104 sshd: partner-acme@internal-sftp
The RSS column is resident memory in kilobytes — the part of each process actually sitting in RAM. Here each session costs roughly 16 MB across its pair of processes, the number you multiply by your expected session count when sizing memory.
In both models the number of connections equals the number of workers, and every worker costs memory and scheduling time whether or not it is doing anything. The operating system switches the CPU between hundreds of workers many times a second (a context switch), and that overhead grows with the count. An idle connection is not free; it is merely cheap. The Thread Count and Working Set counters under Process in Windows Performance Monitor show the cost directly.
What One Connection Costs, Resource by Resource
A transfer server has four resources that can run out: memory, CPU, disk, and network. Two smaller bookkeeping resources — file handles and port numbers — can also run out, and they cause the strangest symptoms.
Memory
Each session holds its worker's stack, the server's per-session bookkeeping (who is logged in, current directory, permissions), and its socket buffers. Socket buffers are the operating system's staging area for data in flight on a connection. One transfer across a fast, long-distance link can hold several megabytes in them. As a planning figure, a thread-based FTP session costs a few megabytes and a process-based SFTP session ten to twenty; an active transfer adds a few more. Memory is rarely the first resource to run out. But when it does the machine swaps and everything else looks slow at once, the most misleading failure of all.
CPU
Plain FTP barely touches the CPU: the server copies bytes between network and disk and that is all. SFTP, FTPS, and HTTPS are different, because every byte is encrypted or decrypted, and the CPU does that work. Modern processors include hardware instructions for the AES cipher that make it fast, but in SSH-based protocols the encryption for one session runs on one core. So a single SFTP transfer can never go faster than one core can encrypt, however many cores the server has. Load only spreads across cores when there are many sessions. See our SFTP performance article for that ceiling.
Two other CPU costs surprise people. The login handshake — key exchange and authentication before any file moves — is far more expensive per second than steady-state transfer. So three hundred partners connecting in the same ten seconds is a CPU spike even if the transfers that follow are small. And directory listings of folders holding tens of thousands of files cost CPU and disk on every request.
Disk
Storage has two separate ceilings. Throughput is how many megabytes per second the disk can move. IOPS (input/output operations per second) is how many separate read or write requests it can complete per second. A single spinning disk manages roughly one to two hundred IOPS; a solid-state disk manages tens of thousands. The catch is that one client writing one big file is a friendly sequential stream. But three hundred clients writing at once is, from the disk's point of view, three hundred interleaved streams. Those are random writes, which are paid for in IOPS, not throughput.
When requests arrive faster than the disk completes them, they wait in line. The length of that line is the queue depth, the single best indicator that storage is the bottleneck. On Linux iostat -x shows it as aqu-sz; on Windows it is Avg. Disk Queue Length under PhysicalDisk. A queue above two per physical disk for minutes at a time means the disk is saturated.
Network
The network interface is one shared pipe. A 1 Gbit/s interface carries about 125 MB/s in theory and 110 to 118 MB/s in practice after TCP and IP overhead. That budget is divided among every active transfer, and no server-side tuning changes the arithmetic. Watch Bytes Total/sec under Network Interface on Windows, or the rxkB/s and txkB/s columns of sar -n DEV on Linux.
File handles and ports
A file handle (a file descriptor on Linux) is the operating system's ticket for anything a process has open: a file, a socket, a log. Every connection consumes at least one, every open file another, and each process has a maximum. On Linux the default per-process limit is often 1024, which a busy server can exhaust. The command ulimit -n shows the current value. When the limit is hit the server refuses connections with a "too many open files" error that has nothing to do with disk space. Windows has a far higher ceiling, but Handle Count is still worth watching for leaks.
Ephemeral ports are the temporary port numbers an operating system hands out for the client end of outbound connections. Inbound connections do not consume them — a thousand clients can all connect to port 22 — so they are mainly a client-side limit. The server-side equivalent is the FTP passive port range. Each passive-mode data connection needs its own port from that range while the transfer runs. So a range of one hundred ports means at most about one hundred simultaneous FTP transfers, and often fewer. That is because a port that just finished may sit for a minute or two in TIME_WAIT before it can be reused. See our guide to configuring passive port ranges.
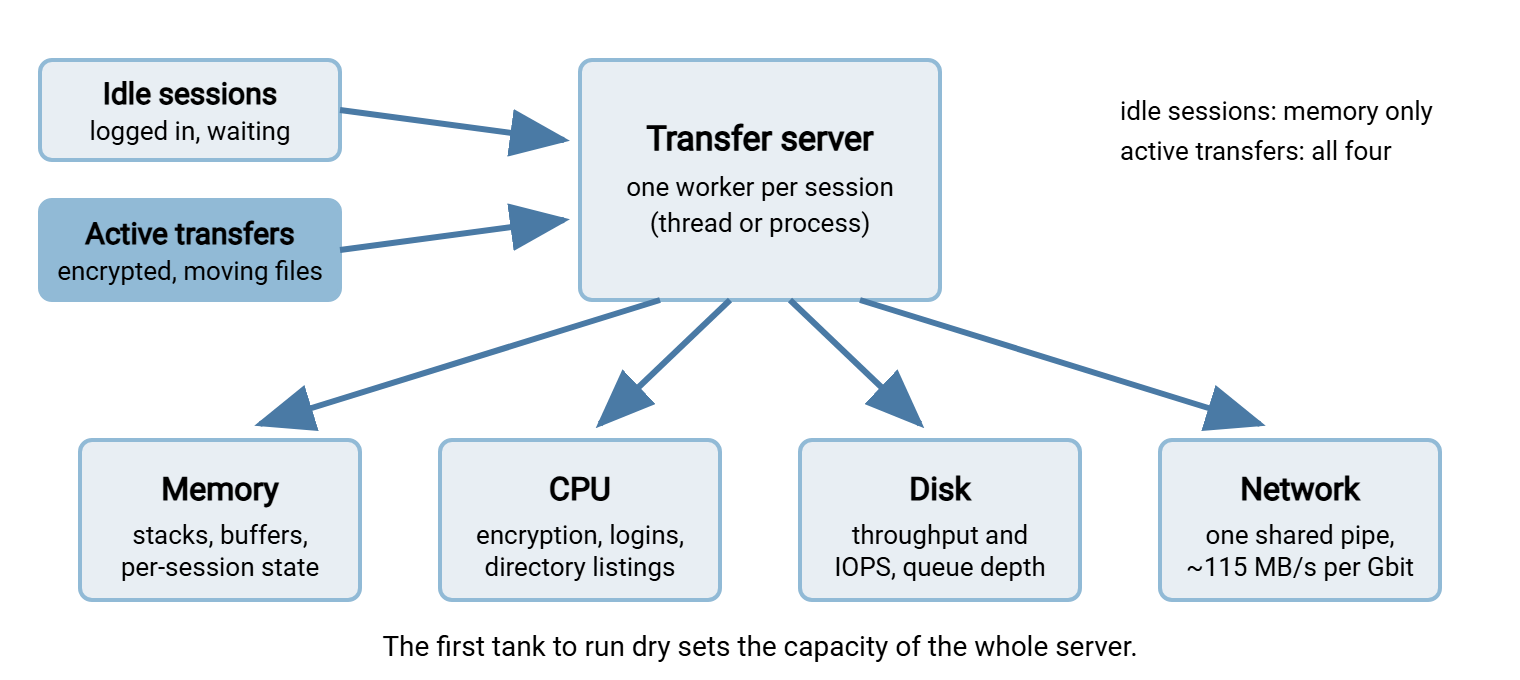
The diagram below shows the four resources as tanks that incoming sessions draw from. Idle sessions draw mostly memory; active encrypted transfers draw from all four; whichever tank runs dry first sets the capacity of the whole server.
Where Servers Saturate First
Saturation means a resource is at its ceiling with work queued behind it. The CPU is at 100 percent with threads waiting, the disk queue is growing, or the network interface is sending at line rate. Headroom is the gap between your normal peak and that ceiling — the reserve that absorbs a surprise. Which resource saturates first depends on the workload more than on the hardware.
| Workload shape | Usually saturates first | The counter that proves it |
|---|---|---|
| Many concurrent large uploads to spinning disks | Disk (IOPS, then queue depth) | aqu-sz / Avg. Disk Queue Length climbing, %util near 100 |
| A few very fast encrypted transfers | One CPU core per session | Per-core view in top (press 1) or Processor(n)\% Processor Time |
| Dozens of sustained transfers on a fast disk | Network interface | Bytes Total/sec at ~115 MB/s per gigabit and flat |
| Hundreds of partners logging in within seconds | CPU (key exchange), then login rate limits | CPU spike with little disk or network traffic |
| Thousands of mostly idle sessions | Memory, file handles, or the connection cap | Available MBytes falling, "too many open files," 421 replies |
| Many small files per session | Per-operation overhead (CPU and disk IOPS) | High IOPS with low MB/s; throughput far below the link speed |
The last row fools everyone once: ten thousand 4 KB files move only 40 MB but cost ten thousand file creates, permission checks, and round trips. See the many-small-files problem.
A Worked Example: Eight Cores, One Gigabit, Three Hundred Partners
Suppose you run an SFTP server with 8 cores, 16 GB of memory, a mirrored pair of spinning disks, and a 1 Gbit/s interface. Three hundred partners each upload a 200 MB month-end file, and their scheduled jobs all fire at two in the morning on the last day of the month. Which resource gives out?
- Network. Three hundred files of 200 MB is 60 GB. At a practical 115 MB/s the interface needs about 520 seconds — nine minutes — to carry it all, however the sessions are arranged. That is the floor.
- CPU. Encrypting 115 MB/s of SSH traffic with hardware AES is well within 8 cores. The login burst is different: three hundred key exchanges inside ten seconds will pin every core briefly, then calm.
- Memory. Three hundred process-based sessions at roughly 16 MB each is about 5 GB, plus socket buffers. A 16 GB server is fine.
- Disk. This is where it breaks. The server writes 115 MB/s, but as three hundred interleaved streams arriving in chunks of 32 to 64 KB. At 64 KB per write that is about 1,800 write operations per second. A mirrored pair of spinning disks delivers perhaps 200. The write queue balloons, every upload's acknowledgments slow down, and clients time out. The CPU sits at a misleading thirty percent because it is waiting on the disk.
The iostat output during that window would look like this (columns trimmed):
$ iostat -x 5
Device     r/s     w/s   rkB/s    wkB/s  r_await  w_await  aqu-sz  %util
sda       2.4  1712.6    96.0  109606.4     4.10   187.55   41.30  100.00
Read it left to right: 1,712 writes per second, 110 MB/s written. Each write waits an average of 187 milliseconds (w_await). There are 41 requests queued on average (aqu-sz), and the device is busy 100 percent of the time. That is a saturated disk, and the fix is storage — solid-state disks, a battery-backed write cache, or more spindles — not more CPU. The sizing article turns this arithmetic into a worksheet for your own server.
Reading Load on a Live Server
You do not need special tools to answer "what is this server doing right now?" The operating system already keeps every number that matters; our server health monitoring series covers turning them into ongoing alerts.
Counting connections
On Linux, ss -s prints a socket summary:
$ ss -s
Total: 1418
TCP:   396 (estab 312, closed 58, orphaned 0, timewait 55)

Transport Total     IP        IPv6
TCP       338       331       7
INET      347       337       10
The figure to read is estab 312 — 312 established connections of any kind on this host. The timewait 55 figure is recently closed connections the kernel is holding briefly. A very large number there on an FTP server hints that passive ports are being recycled faster than they are released. On Windows, the classic one-liner counts established connections machine-wide, and the PowerShell version narrows it to one listening port:
C:\> netstat -an | find /c "ESTABLISHED"
304

PS C:\> (Get-NetTCPConnection -State Established -LocalPort 22).Count
297
The four resources at once
On Windows, Get-Counter reads the same counters Performance Monitor graphs. One call samples the essentials:
PS C:\> Get-Counter -Counter @(
  '\Processor(_Total)\% Processor Time',
  '\Memory\Available MBytes',
  '\PhysicalDisk(_Total)\Avg. Disk Queue Length',
  '\PhysicalDisk(_Total)\Avg. Disk sec/Write',
  '\Network Interface(*)\Bytes Total/sec'
) | Select-Object -ExpandProperty CounterSamples | Format-Table Path, CookedValue -AutoSize

Path                                                          CookedValue
----                                                          -----------
\\srv-xfer-01\processor(_total)\% processor time                  31.4
\\srv-xfer-01\memory\available mbytes                           9412
\\srv-xfer-01\physicaldisk(_total)\avg. disk queue length         38.7
\\srv-xfer-01\physicaldisk(_total)\avg. disk sec/write             0.181
\\srv-xfer-01\network interface(ethernet0)\bytes total/sec   114203688
Reading it: the CPU is a third busy, and there is plenty of free memory. The network is at about 114 MB/s (essentially full for a gigabit link). The disk queue is at 38 with each write taking 181 milliseconds. Same story as the Linux example, told in different counters: the disk is the wall. On Linux, vmstat 5 tells the equivalent story. The wa column (CPU time spent waiting for I/O) climbing while us and sy stay low is the signature of a disk-bound server. A server that runs as a Windows service, as Sysax Multi Server does, appears under the Process object like any other process. So its thread count, handle count, and working set are one counter away.
Idle Sessions, Timeouts, and Why Limits Exist
An idle session holds its worker, its memory, its file handles, and — most importantly — a slot against the connection limit, while doing nothing. Scripts that crash without disconnecting and probes that log in and never log out accumulate silently. A server whose limit is 300 sessions can be "full" with sixty real users if the other 240 slots belong to ghosts.
Two settings keep that in check. Idle timeouts disconnect sessions that have sent nothing for a set period; balancing that against legitimate slow clients is the subject of our timeouts and keepalives series. And connection limits — global, per-user, per-IP — stop any one source from consuming the whole server. On a shared server they are a protection, not a restriction: they turn "everyone slows to a crawl" into "the three hundred and first connection waits a moment and retries."
Gotcha: a CPU at thirty percent does not mean the server has room. Check the disk queue and the network interface before concluding anything — a server waiting on its disk looks idle from the CPU's point of view.
What to Take Away
A transfer server gives each client a worker, and every worker costs memory whether or not it is busy. Transfers cost disk and network; encrypted transfers cost CPU as well, one core per session. Which resource saturates first depends on the shape of the load. Many concurrent streams punish disks, and a few fast encrypted streams punish single cores. Sustained volume fills the network, and login bursts spike the CPU.
A natural next step is connection limits and per-user caps, which turn these costs into protective settings. Another is sizing a transfer server, which turns them into a hardware worksheet. When a transfer is slow for one partner rather than for everyone, start instead with our diagnosing slow transfers series. That is usually a path problem, not a capacity problem.
Frequently Asked Questions
What is the difference between a connection and a session?
How much memory does one SFTP session use?
Why is my CPU only thirty percent busy when the server feels overloaded?
What is queue depth and what number is bad?
Does adding more cores make a single SFTP transfer faster?
From the Sysax team: we build secure file transfer software for Windows. Sysax Multi Server is an FTP, FTPS, SFTP, and HTTPS server. Sysax FTP Automation handles scheduled, scripted transfers. Free trials are on the download page.