
Disk, Sessions, and Queue Depth: The Core Metrics
A synthetic login tells you the server works right now. The core metrics tell you whether it will still work in an hour. Three numbers capture the resource pressure that turns a healthy server into a failing one. They are how full the disk is, how many sessions the server is carrying, and how many items are waiting in its queue. They are cheap to collect, they trend predictably, and read together they warn you before anything actually breaks.
This article shows exactly what to collect and where each number comes from on Windows and Linux. It shows how to set thresholds that mean something instead of thresholds copied from a forum post. It covers the difference between a spike you can ignore and a trend you cannot. It also covers the part most guides skip: the relationships between the three metrics that reveal trouble earlier than any one of them alone. This is part of our server health monitoring series. The health model behind these dimensions comes from what healthy means for a transfer server.
Metric, Threshold, Trend: The Vocabulary
A metric is a number you sample over time — percent disk used, session count, queue depth. Unlike a yes-or-no check, a metric has a value that drifts, so watching it means watching a series of readings, not a single one.
A threshold is the line a metric crosses to mean "act." Good thresholds come in two levels: a warning that says "look at this soon" and a critical that says "act now." The gap between them is your reaction time, so set the warning far enough below critical that crossing it still leaves you room to respond calmly.
A spike is a brief jump that returns to normal on its own. Think of a batch window that fills sessions for ten minutes, or a large upload that dips free space and then completes. A trend is a sustained movement in one direction — disk climbing two points a day, sessions peaking higher each week. The single most important skill with metrics is telling these apart, because a spike needs no action and a trend is a scheduled emergency. Alert on trends; log spikes.
Remember: a threshold answers "how bad is it now," but a trend answers "how much time do I have." A disk at 70 percent is comfortable until you notice it was at 60 percent last week. At that rate it is a two-week problem, and now is when fixing it is cheap.
Metric One: Disk
Disk is the metric that fails most abruptly, because a transfer server writes constantly — incoming files, temporary files, logs. A disk at 100 percent stops all of it at once. Collect two views. Use percent used (or its inverse, percent free) for a quick health read. Also collect absolute space remaining in gigabytes, because a percentage hides how much runway a large volume actually has.
On Windows, a one-line query reads free space per volume:
PS> Get-PSDrive C | Select-Object Used, Free

        Used         Free
        ----         ----
 402653184000 139586437120
For continuous sampling, Performance Monitor counters are the standard source, read from the command line with Get-Counter. The two disk counters worth watching are free space as a percentage and free megabytes:
PS> Get-Counter '\LogicalDisk(C:)\% Free Space',
>>              '\LogicalDisk(C:)\Free Megabytes'

Timestamp                 CounterSamples
---------                 --------------
Mar 14 02:10:00           \\srv\logicaldisk(c:)\% free space : 26.0
                          \\srv\logicaldisk(c:)\free megabytes : 133120
On Linux the equivalent is df, which shows both the percentage and the absolute space in one table:
$ df -h /srv/transfer
Filesystem      Size  Used Avail Use% Mounted on
/dev/sdb1       500G  370G  130G  74% /srv/transfer
One trap on Linux: a volume can report free space while still refusing to write, because it has run out of inodes. These are the fixed-count structures that track individual files. A transfer server holding millions of tiny files can exhaust inodes long before it exhausts bytes. Check with df -i and watch that percentage too. What actually consumes transfer-server disk, and how to plan capacity, is the whole subject of the Group V pillar on storage growth on transfer servers.
One more thing to watch on disk: which volume. A transfer server ideally keeps user data, logs, and temporary files on separate volumes. That way, a runaway log cannot fill the volume that holds transfers, and a flood of uploads cannot starve the log. If everything shares one volume, a single percentage tells the whole story. But sharing one volume also means any one of those three can take down all of them. When you monitor disk, monitor every volume the server writes to, not just the system drive. The one you forget is the one that fills.
Metric Two: Concurrent Sessions
A session is one client's live connection. The metric is the count of sessions active at once. It matters because every server has a ceiling — a configured maximum, bounded by memory and CPU. Connections beyond it are refused. Unlike disk, session count is spiky by nature. It can sit near zero all afternoon and slam into its ceiling for a few minutes when a batch window opens and every partner connects together.
The best source for session count is the server's own administration, because it counts real authenticated sessions rather than raw sockets. A server such as Sysax Multi Server exposes current connections through its web-based administration, which is more accurate than counting at the network layer. When you have no such view, you can approximate from the operating system by counting established connections to the listening port. Here, that is SFTP on port 2222:
PS> (Get-NetTCPConnection -LocalPort 2222 -State Established).Count
14
$ ss -tan 'sport = :2222' | grep -c ESTAB
14
Treat the network count as a rough proxy. It can over-count connections that are lingering in a closing state, and it cannot see how close you are to a per-user cap. What you really want to track is the peak, not the average. A server averaging four sessions might peak at its ceiling of forty every night at midnight. It is already refusing connections during that window even though its average looks idle. The sizing and per-user limits behind these ceilings are covered in the Group V pillar on server capacity and concurrency.
Metric Three: Queue Depth
Queue depth is the number of items waiting to be handled. On a transfer server the queue is usually a folder. It might be an outbox of files waiting to be collected, an inbox of files waiting to be processed, or a pickup directory a partner drains. The metric is simply how many files are sitting there, and often a second number — the age of the oldest item. That is because a queue that is not shrinking is worse than a queue that is merely large.
Counting is straightforward. On Windows, count the files in the outbox and find the oldest:
PS> $q = Get-ChildItem D:\transfer\outbox -File
PS> $q.Count
37
PS> ($q | Sort-Object LastWriteTime | Select-Object -First 1).LastWriteTime
Saturday, March 14, 12:41:00 AM
Queue depth is the earliest-warning metric of the three, because it rises before anything fails. Suppose a pickup folder normally empties within minutes and now holds three dozen files, the oldest of them two hours old. It is telling you the downstream partner stopped collecting. It is telling you now, well before the missed-file alert that job monitoring would eventually raise. Knowing your baseline is everything: a depth of thirty-seven means nothing until you know the folder is normally near zero. The flow-level side of this — did the expected file actually arrive — is freshness checks for expected files.
Supporting Metrics: Throughput and CPU
Disk, sessions, and queue depth are the core three because they map directly to the failures a transfer server suffers. Two more numbers are worth collecting as context, because they explain why the core three move. The first is network throughput — how many bytes per second the server is pushing and pulling. On Windows the Performance Monitor counter is the network interface's total byte rate:
PS> Get-Counter '\Network Interface(*)\Bytes Total/sec' |
>>   Select-Object -ExpandProperty CounterSamples |
>>   Where-Object InstanceName -notmatch 'loopback|isatap' |
>>   Format-Table InstanceName, CookedValue

InstanceName                         CookedValue
------------                         -----------
intel-r--ethernet-connection      42315776
Throughput is the metric that explains a session spike. Forty sessions all pulling large files at once will pin the network. A throughput number sitting flat at the interface's ceiling tells you the link, not the server, is the bottleneck. The second context metric is CPU, which on an encrypted transfer server is consumed largely by the encryption itself. A CPU near its ceiling during a busy window explains slow logins and rising probe times. Neither of these is a health metric on its own — a busy network is doing its job. But read alongside the core three they turn "something is wrong" into "here is why." The physics of throughput ceilings and how far you can push them belongs to the Group V pillar on server capacity and concurrency.
Thresholds That Mean Something
A threshold copied from someone else's server is a guess. A threshold set from your own baseline is a decision. Here is a starting frame — adjust every number to your own runway and reaction time.
| Metric | Warning | Critical | Why this level |
|---|---|---|---|
| Disk used | 80% | 90% | Warning leaves days of runway; critical still leaves hours on most volumes. |
| Absolute free space | Below one day's intake | Below your largest expected file | A percentage hides how little room a big transfer actually needs. |
| Peak sessions | 70% of ceiling | 90% of ceiling | Warning gives time to raise the limit or add capacity before refusals begin. |
| Queue depth | Several times baseline | Oldest item past its deadline | Depth alone is noisy; age against a deadline is the real signal. |
Two of these thresholds are deliberately relative rather than absolute — "several times baseline," "one day's intake." A fixed number that fits one server is wrong for another. That is the whole lesson of thresholds: they are properties of your workload, discovered by watching it, not constants you can look up.
Reading the Metrics Together
Any single metric can mislead. Read in pairs, they tell a story that names the problem before you have to go looking. The diagram below shows the three most useful combinations.
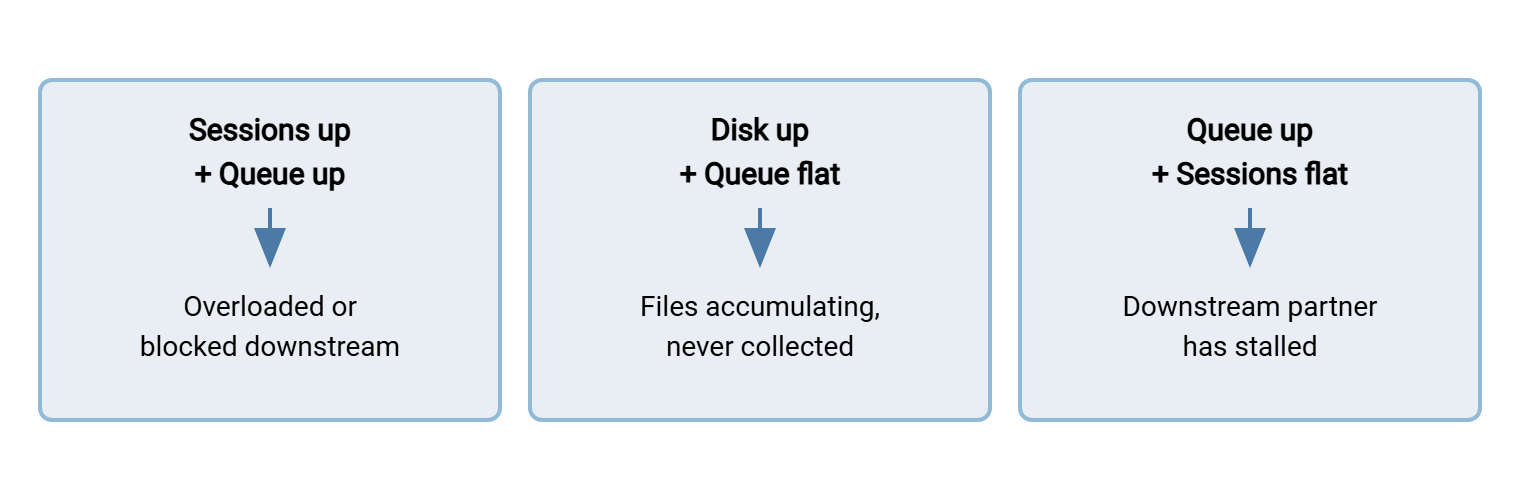
Walk through them. Sessions rising and queue rising together means the server is admitting work faster than it can finish it. That is classic overload, or a downstream dependency that has slowed everything down. Disk rising while the queue stays flat is accumulation. Files are arriving and landing, but nothing is removing the old ones, so the outbox is a graveyard rather than a queue. Queue rising while sessions stay flat points outward. Your server is fine and idle, but whoever was supposed to collect from it has stopped. Each pair sends you to a different place to look, which is exactly what turns raw numbers into a diagnosis.
A Worked Example
Concrete numbers make the method stick. Suppose your baseline for a partner-facing SFTP server is this. Disk holds steady around 55 percent. Sessions average four and peak near twelve during the midnight batch window. The pickup outbox stays under five files, and the oldest file is never more than a few minutes old. Those are the numbers you learned by watching, and they are what "normal" means for this server.
Now the morning readings come in: disk 71 percent, sessions peaking at eleven, outbox holding sixty-three files with the oldest six hours old. Read them in pairs. Sessions are normal, so the server is not overloaded. Queue is far above baseline and the age is the alarming part — six hours means the partner has not collected since the batch ran. Disk has climbed sixteen points, and the pairing tells you why. The outbox is filling because nothing is draining it, so bytes are piling up. One glance across three metrics has told you the server is healthy and the partner's pickup has stalled. It has also told you your disk will be the next casualty if the backlog is not cleared. You now know exactly who to call and roughly how long until the disk itself becomes an emergency. None of it required opening a single log file.
Contrast that with a different morning. Disk is at 56 percent (normal), and the outbox holds two files (normal). But sessions are pegged at forty, your configured ceiling, from two until three in the morning. Probe response times triple in the same window. That pattern is the opposite diagnosis. The server is being overwhelmed by concurrent connections during the batch window and refusing some of them. Meanwhile, disk and queue look perfectly calm. Same three metrics, entirely different story, and each points at its own fix.
Collecting It All in One Pass
You do not need a heavy tool to gather these. A short script that samples all three metrics and writes one line makes a foundation you can schedule and later feed to a dashboard. This PowerShell example collects disk, sessions, and queue depth into a single comma-separated record:
# gather-metrics.ps1 -- one CSV line per run
$time    = Get-Date -Format "s"
$freePct = [math]::Round((Get-Counter '\LogicalDisk(C:)\% Free Space').CounterSamples.CookedValue, 1)
$freeMB  = [int](Get-Counter '\LogicalDisk(C:)\Free Megabytes').CounterSamples.CookedValue
$sessions = (Get-NetTCPConnection -LocalPort 2222 -State Established).Count
$queue   = (Get-ChildItem D:\transfer\outbox -File).Count

"$time,$freePct,$freeMB,$sessions,$queue" |
    Out-File -Append -Encoding utf8 D:\health\metrics.csv
Scheduled every few minutes, this builds a history you can chart, threshold, and review — the raw material the health dashboard renders. Keep the collector simple and reliable. A metrics gatherer that itself fails silently is worse than none. So give it the same error handling any scheduled job deserves, as in PowerShell error handling and logging.
A CSV like this is deliberately dumb, and that is its strength. It has no dependencies, it opens in any spreadsheet, and a year of readings taken every few minutes is still a small file. If you later want to keep only recent history, trim old rows on a schedule. If you want to keep everything for capacity planning, the file stays cheap. Resist the urge to reach for a heavy monitoring platform before you have outgrown a text file. For a single transfer server, a scheduled script writing one line at a time answers every question in this article. It hands the dashboard everything it needs.
Bringing It Together
Three metrics, three sources, one habit. Collect disk (percent and absolute) and peak sessions (from the server if you can, the network if you cannot). Collect queue depth with the age of the oldest item. Set thresholds from your own baseline, watch trends rather than spikes, and read the metrics in pairs so the numbers tell you where to look. Do that and you will see most capacity problems days before they become outages.
From here, add the time-based dimensions that these snapshots miss. See certificate and key expiry for the credentials that expire on a schedule. See log growth and log health for the metric that is both a warning sign and a disk risk. All of them converge on the dashboard.
Frequently Asked Questions
Should I track disk as a percentage or in gigabytes?
Why watch peak sessions instead of the average?
What is queue depth on a transfer server?
How do I tell a harmless spike from a real trend?
Can I trust a network connection count as the session count?
How often should I sample these metrics?
From the Sysax team: we build secure file transfer software for Windows. Sysax Multi Server is an FTP, FTPS, SFTP, and HTTPS server. Sysax FTP Automation handles scheduled, scripted transfers. Free trials are on the download page.