
What Healthy Means for a Transfer Server
Ask most administrators whether their file transfer server is healthy and they will check whether last night's transfer ran. That is a fair instinct, but it answers the wrong question. Whether a specific file arrived is job health — the health of one flow. Whether the service that carries every flow is well is server health, and the two can disagree completely. A server can be minutes from a full disk while every job still succeeds. A single job can fail on a server that is otherwise perfectly fine.
This article draws the line between those two ideas and then lays out the dimensions of server health, one at a time. Is the service reachable? Is it authenticating? Does it have disk? How many sessions is it carrying? How deep is its work queue? When do its certificates and keys expire? Are its logs behaving? Each dimension answers a specific question and predicts a specific failure. By the end you will have a mental checklist you can apply to any transfer server. You will know which of the other articles in this series goes deeper on each item.
Nothing here assumes prior monitoring experience. Every term — liveness, metric, threshold, queue depth — is defined the first time it appears. This is the opening article of our server health monitoring series. It is the map the rest of the series fills in.
The Service Versus the Jobs
Start with the distinction, because everything follows from it. A transfer server is a piece of software that listens for connections, authenticates users, and moves files. The jobs are the individual flows that ride on top of it. Think of the nightly export a partner picks up, the invoice batch a scheduled client pushes, or the reports a customer uploads through a portal.
Job monitoring asks, "Did the expected file arrive, on time, intact?" That is a question about a flow, and it belongs to a different discipline. Our companion series on transfer job monitoring covers freshness checks, expected-file alerts, and why jobs fail silently. Server health asks a question underneath all of that: "Is the machine that carries every job well enough to keep carrying them?"
The reason to separate them is that each hides the other's problems. If you only watch jobs, a server creeping toward a full disk looks healthy right up until the moment every job fails at once. If you only watch the server, a partner whose credentials expired looks fine. The service is up, authenticating other users, with plenty of disk. Meanwhile, that partner's specific flow quietly dies. You need both lenses. This series builds the server lens; the job series builds the other, and the two belong side by side on the same wall.
Remember: "The transfer ran" and "The server is healthy" are different claims. A green job dashboard can sit on top of a server that is one busy night away from an outage. Watch the service itself, not only the flows it carries.
The Health Pyramid: What Has to Be True, In Order
Server health is layered. The lower layers must hold before the upper ones can. A useful way to picture it is a pyramid. The process must be running before a port can be open. The port must be open before a login can succeed. A login must succeed before a transfer can complete. And transfers must complete before files actually flow for real users. If a lower layer fails, everything above it fails too, which is why the order matters when you diagnose.
The diagram below shows the pyramid from the foundation up. Read it as a sequence of yes-or-no questions, each one gating the next.
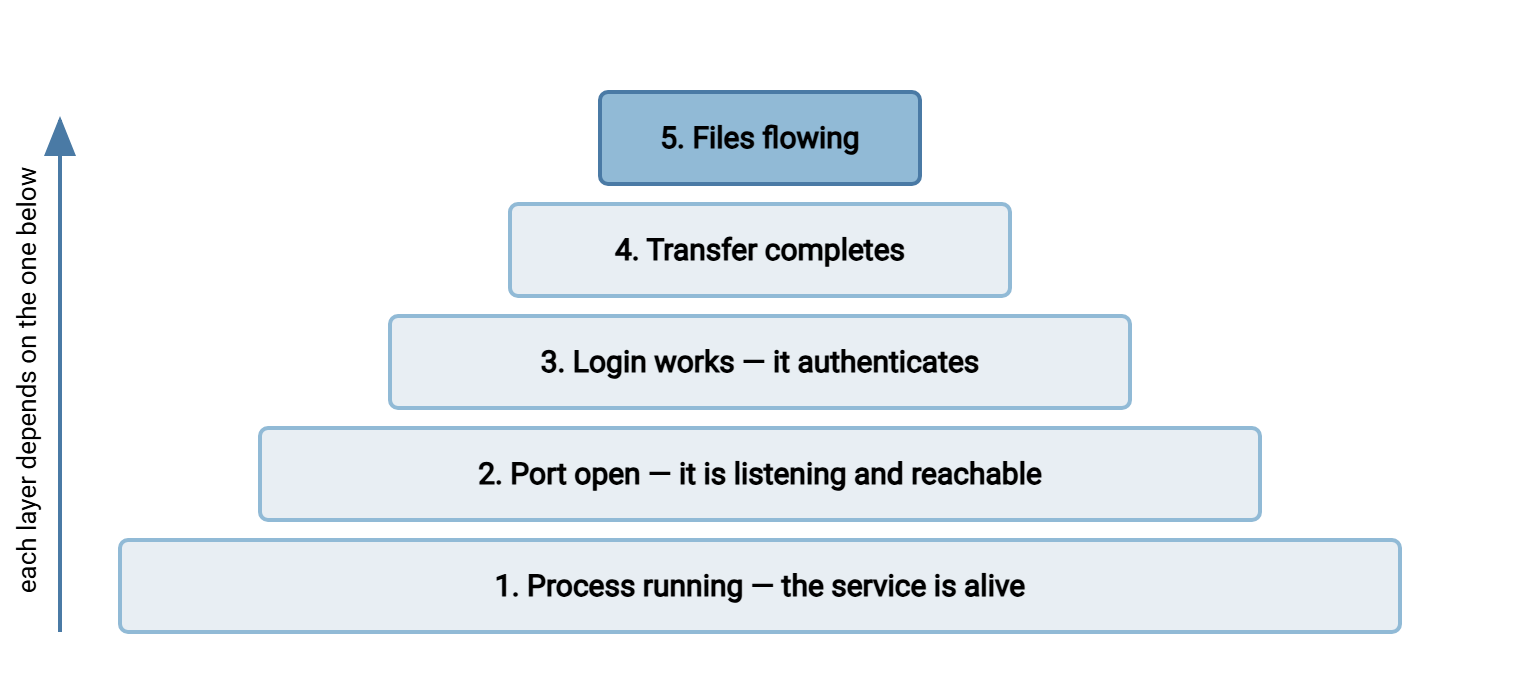
Every health dimension in the rest of this article maps onto this pyramid. Liveness probes test layers one through four. Disk, sessions, and queue depth are the resources that let layer four keep succeeding under load. Certificates and keys are what let layers two and three happen at all for encrypted protocols. Logs are the record that tells you which layer broke when something does. Keep the pyramid in mind and the dimensions stop feeling like a random list.
Dimension One: Reachable
Reachability is the bottom of the pyramid: is the process running, and is its port open and accepting connections? A transfer server is unreachable if it has crashed, its service has stopped, or its listening port is blocked by a firewall change. That holds no matter how much disk or how many valid accounts it has.
The question this dimension answers is the most basic one: "Can anyone connect at all?" The failure it predicts is a total outage — every job fails, every user gets a connection refused or a timeout. Reachability is cheap to check and catches the most catastrophic problems, which is why every health system starts here. On Windows you can confirm the service is running with a one-line query:
C:\> sc query SysaxServer

SERVICE_NAME: SysaxServer
        STATE              : 4  RUNNING
        WIN32_EXIT_CODE    : 0  (0x0)
A running process is necessary but not sufficient. The process can be up while the port is closed to the outside, or up but wedged and not answering. That is why the next dimension exists, and why real liveness checking goes further than "is the service running." The full treatment is in service liveness and synthetic logins.
Dimension Two: Authenticating
A port that accepts connections is not the same as a service that lets people in. Authentication health asks: "When a valid user presents valid credentials, do they get in?" The failure it predicts is a subtle, partial outage — the server is up, the port is open, but logins fail. Causes range from a corrupted user database to an expired service-account password. Another is a full disk that prevents the server from writing the session record it needs before admitting a user.
This is where a bare port check misleads you. A port scanner sees the port open and reports the server healthy; meanwhile every login is being rejected. The only honest test is to actually log in the way a real user would. That is exactly what a synthetic login does. It is a scripted, automated login performed on a schedule purely to prove the path works. We build those in the liveness article.
A worked example makes the trap concrete. Suppose a server's system drive fills to the point where it cannot append to its authentication log. Many servers refuse a login they cannot record, on the reasonable principle that an unlogged access is worse than a denied one. From the outside, the port answers instantly and the network looks perfect, yet every real user is turned away. A reachability check passes, a synthetic login fails, and the difference between those two results points straight at the cause. That gap — port open, login refused — is one of the most useful diagnostic signals a health system produces. It exists only because you tested authentication separately from reachability.
Dimension Three: Disk
Disk is the resource a transfer server consumes most relentlessly, because moving files is its entire job and files pile up. Disk health asks: "Is there room to accept the next file, write the next log line, and create the next temporary file?" The failure it predicts is severe and abrupt. When a disk fills, uploads fail mid-transfer and the server often cannot even write its own logs. In the worst case, the full disk stops the service.
Disk is a metric rather than a yes-or-no check. A metric is a number you sample over time, like percent used or gigabytes free. That means it needs a threshold: a line that, once crossed, means "act now." A sensible pattern is a warning threshold with days of runway left and a critical threshold that demands immediate action. Because disk fills gradually, its trend is often more useful than its current value. A disk at seventy percent that climbs two points a day is a scheduled emergency. Disk sits alongside sessions and queue depth in the core metrics article. The deeper question of what is eating the space belongs to the Group V pillar on storage growth on transfer servers.
Dimension Four: Sessions
A session is one client's active connection to the server. Session health asks: "How many connections is the server carrying right now, and how close is that to what it can handle?" Every server has a ceiling — a maximum number of concurrent sessions, set by configuration and bounded by memory and CPU. The failure this dimension predicts is a capacity outage. Once the server hits its session limit, new connections are refused even though the service is otherwise perfectly healthy.
Session count is the health dimension that most often surprises people, because it is invisible until it bites. A server might run comfortably at a dozen sessions all day. It can hit its ceiling for ten minutes during a nightly batch window when every partner connects at once. Watching the peak, not just the average, is what catches this. The sizing and limits behind those ceilings are the subject of the Group V pillar on server capacity and concurrency. Here we treat the live session count as a health signal to watch.
Dimension Five: Queue Depth
Not every transfer server has a queue, but many automation setups do: files arrive, wait to be picked up or processed, and move on. Queue depth is the number of items waiting. Queue health asks: "Is work arriving faster than it is being cleared?" The failure it predicts is a backlog that grows without bound. Think of files that should have gone out an hour ago, still sitting in an outbox. Or think of a pickup folder filling because the downstream partner stopped collecting.
Queue depth is powerful because it reveals trouble early, before anything has actually failed. A queue that is normally near zero and is now steadily rising tells you something downstream has stalled. It tells you minutes or hours before a deadline is missed. The key is knowing your baseline. A depth of fifty means nothing until you know whether fifty is a quiet Tuesday or a five-alarm fire. Queue depth joins disk and sessions in the core metrics article.
Notice how the resource dimensions relate to one another, because that relationship is where early warnings hide. A rising session count and a rising queue depth together often mean the server is admitting connections faster than it can clear their work. That is a classic sign of an overloaded or downstream-blocked service. A climbing disk with a flat queue points instead at accumulation: files arriving and never being collected. Reading two metrics together tells you more than reading either alone. Learning those pairings is a large part of what separates a useful health view from a wall of disconnected numbers.
Dimension Six: Certificates and Keys
Encrypted transfer protocols depend on credentials that expire. An FTPS or HTTPS server presents a TLS certificate with an expiry date. An SFTP server has an SSH host key. Partners hold client certificates and public keys. PGP keys used to encrypt files have their own lifetimes. Expiry health asks one question: "Is anything about to expire that will break connections when it does?"
The failure this dimension predicts is the cruelest kind, because it is scheduled in advance and still surprises everyone. A certificate expires at a precise moment, and at that moment every client that validates it stops connecting. Often, several partners are affected at once, often outside business hours. It always happens without warning if nobody was watching the date. The fix is to treat "days remaining" as a health metric with a generous lead time. That way, a renewal is a calm calendar task rather than a 3 a.m. incident. That is the whole subject of certificate and key expiry as health signals. The mechanics of getting and renewing certificates live in the Group II certificate management series.
Dimension Seven: Logs
Logs are both a health signal and a health risk. As a signal, the error rate in the logs is one of the earliest indicators that something is going wrong. Look at how many failures occur per hour, and whether that number is climbing. As a risk, logs grow, and a logging directory that grows unchecked is one of the most common causes of the full disk described above. There is also a quieter failure: a log that suddenly goes silent. A transfer server that normally writes hundreds of lines an hour and now writes none is usually not idle. Usually, it is stuck or its logging has broken. A silent log is often a sick server.
The question logs answer is layered: "Are errors rising? Are the logs themselves growing dangerously? Are they still being written at all?" We give logs a full treatment in log growth and log health. What to log in the first place, and how long to keep it, is governance covered in the Group II/III transfer logging and audit series.
Putting the Dimensions Together
Here is the whole model as a checklist. For each dimension, the table names the question it answers and the failure it predicts. It says whether each dimension is a yes-or-no check or a metric with a threshold. This is the frame the rest of the series hangs on, and the dashboard in the final article renders exactly these rows on one screen.
| Dimension | Question it answers | Failure it predicts | Kind |
|---|---|---|---|
| Reachable | Can anyone connect at all? | Total outage | Yes/no check |
| Authenticating | Do valid users get in? | Silent partial outage | Yes/no check |
| Disk | Room for the next file? | Abrupt failure when full | Metric + threshold |
| Sessions | How close to the ceiling? | Refused connections at peak | Metric + threshold |
| Queue depth | Is work piling up? | Growing backlog, missed deadlines | Metric + threshold |
| Certificates & keys | Is anything about to expire? | Scheduled surprise outage | Metric (days left) |
| Logs | Errors rising? Logs safe? Still writing? | Missed early warning; disk full | Metric + check |
Notice the pattern in the failures: none of them is "a job did not run." Every one is a way the service lets its jobs down. That is the whole point of the server lens. When you run a Windows server product such as Sysax Multi Server, several of these dimensions are visible in its own administration and logging. It runs as a Windows service, writes activity logs to file and to a database with rollover, and exposes session and configuration state through web-based administration. That gives you a head start on collecting the numbers this series turns into a dashboard.
Where to Go From Here
You now have the model: two lenses (service and jobs), a pyramid (running, listening, authenticating, transferring, flowing), and seven dimensions. Each dimension is tied to a question and a predicted failure. The rest of the series takes them one at a time. Start with service liveness and synthetic logins for the bottom of the pyramid, then the core metrics for the resource dimensions. When you are ready to assemble everything into one view, the dashboard article renders all seven dimensions on a single screen. And for the flow-level half of the picture, keep job status monitoring in the neighboring window.
Frequently Asked Questions
What is the difference between server health and job monitoring?
If my transfers are all succeeding, do I still need health monitoring?
Why does the order of the health pyramid matter?
What is a threshold, and how do I pick one?
Which health dimension should I set up first?
From the Sysax team: we build secure file transfer software for Windows. Sysax Multi Server is an FTP, FTPS, SFTP, and HTTPS server. Sysax FTP Automation handles scheduled, scripted transfers. Free trials are on the download page.