
Log Growth and Log Health
Logs are the one part of a transfer server that is both a health instrument and a health hazard. Read them and they are your earliest warning that something is going wrong — errors climbing, warnings appearing that were not there yesterday. Ignore them and they quietly grow until they fill the disk and take the whole service down. And in their strangest failure mode, a log that goes completely silent is often the loudest signal of all. A busy server that suddenly stops writing is usually not resting — it is stuck.
This article treats logs as a health topic in their own right. It covers the error rate as a signal, log volume growth as a risk, and rotation and retention as the controls that tame it. It covers the disk-full-because-of-logs outage that catches everyone once, and the silent log that means a sick server. It also covers the log write failure that blinds you at the worst moment. It also covers sizing the Windows Event Log so it does not become its own problem. This is part of our server health monitoring series. What to log in the first place, and how long to keep it for audit, is governance covered in the transfer logging and audit series. Here we care about the health of the logs themselves.
Logs as a Signal: The Error Rate
The most useful health number hiding in your logs is the error rate. That means how many failures the server records per hour, and whether that number is rising. A transfer server always logs some errors: a client drops a connection, a password is mistyped, a partner retries. A low, steady background rate is normal. What matters is the change. A server that logs five errors an hour all week and suddenly logs two hundred an hour is telling you something broke. It often tells you before any single job has failed a freshness check.
Counting is simple. On Linux, count matching lines in the current log; on Windows, filter the log for error-level entries. Here is a one-line count of error lines in the last portion of a log:
$ grep -c -iE 'error|fail|denied' /var/log/transfer/service.log
17
The raw count means little on its own; the trend means everything. Sample it every hour, store the number, and watch for the jump. A doubling is worth a look; a tenfold rise is an alert. Pair the rate with the kind of error. A surge of authentication failures points one way (a partner credential problem, or an attack — see monitoring auth attacks). A surge of disk or write errors points another. The craft of turning log lines into alerts is covered in alerts from transfer logs. The health-side point is just to treat the error rate as a metric with a trend, like disk or sessions.
A worked example shows how much the trend tells you. Suppose the server logs a steady five to eight errors an hour all week — the normal churn of dropped clients and mistyped passwords. On one morning the hourly count reads 6, 7, 9, 140, 155, 160. The first three hours are baseline; the jump to 140 is the alert. The fact that it then holds near 150 rather than falling back tells you it is not a passing blip. Now read the kind. If those hundred-plus errors are almost all authentication failures for one partner, the story is a lapsed partner credential. If they are write failures, the story is a filling disk. The count found the incident; the error type named it. That two-step — rate detects, category diagnoses — is the whole discipline of using logs as a health signal.
Remember: the error rate is a health metric; a single error is not. Alert on the change — a sudden rise above the normal background — not on the presence of errors. Otherwise, you will drown in noise and miss the surge that actually matters.
Logs as a Risk: Growth
Every line a server logs consumes disk, and a transfer server under load logs a great deal. Left unmanaged, the logging directory grows without bound. Because it grows slowly it is invisible — right up until it is the reason the disk is full. Measuring log growth is therefore a health check in its own right: not just how big the logs are now, but how fast they are getting bigger.
Measure the size of the log directory on a schedule and watch the slope. On Windows, sum the sizes:
PS> Get-ChildItem D:\logs -Recurse -File |
>>   Measure-Object -Property Length -Sum |
>>   Select-Object @{ n='LogMB'; e={ [int]($_.Sum / 1MB) } }

LogMB
-----
  742
$ du -sh /var/log/transfer
742M    /var/log/transfer
Record that number daily and the growth rate falls out of the differences. If the directory added roughly forty megabytes a day this week, you know how long it has until it threatens the volume it lives on. That is the same days-of-runway thinking the core metrics use for disk, applied to logs specifically. It is worth doing separately, because a sudden jump in log growth is itself a symptom. Logs that start growing much faster than usual usually mean the error rate has spiked and the server is writing a flood of failure lines. That ties the two log signals together.
The Controls: Rotation and Retention
Two mechanisms keep log growth from ever becoming an outage. Log rotation is the practice of closing the current log file periodically and starting a fresh one, so no single file grows without limit. The old files are renamed and set aside, and after a while the oldest are deleted. Retention is the policy for how long those rotated files are kept before deletion. Rotation controls file size; retention controls total footprint.
Rotation comes in two flavors, and most setups use both:
- Size-based rotation starts a new file once the current one reaches a set size — say, a hundred megabytes. This caps any single file and is predictable under bursty load.
- Time-based rotation starts a new file on a schedule — typically daily — regardless of size. This makes logs easy to find by date and easy to retain by count ("keep thirty files").
The table below compares the two rotation strategies and the archive-off option, so you can choose the mix that fits your server. Most production setups combine size-based rotation (to cap any single file under bursty load) with a retained count of daily files (to make history easy to find). They archive anything that must outlive the local retention window.
| Strategy | Triggers a new file | Best for | Watch out for |
|---|---|---|---|
| Size-based | File reaches a set size | Bursty load; capping single-file size | Files span uneven time periods, harder to find by date |
| Time-based | A schedule, usually daily | Finding logs by date; retain-by-count | A single busy day can produce a huge file |
| Archive off server | Older files moved elsewhere | Long retention without local bloat | The move job itself must be monitored |
The retention number is where health and governance meet. Health wants logs small enough never to threaten the disk; audit and compliance may require logs kept for a defined period. Those goals can conflict, and the resolution is usually to rotate aggressively but archive off the server. That means moving older logs to separate, cheaper storage so the transfer server itself stays lean while the history is preserved elsewhere. Centralizing logs this way is covered in centralizing logs. The retention policy itself is covered in retention basics for admins. A server product such as Sysax Multi Server logs to both file and database with rollover built in, which handles the rotation half without a separate tool.
The Classic Outage: Disk Full Because of Logs
This is the outage every administrator meets once. Logging has no rotation, or rotation that keeps too many files, and over months the logs swell until the volume they sit on fills completely. What happens next depends on which volume it was. If the logs share the volume with transfer data, uploads start failing. If they share the system volume, far worse things happen. In a bitter irony, the server then often cannot log the failure, because there is no room to write the log line that would explain it.
The diagram below shows why this failure is self-concealing. The log growth causes the disk to fill. The full disk stops the server from writing logs. The silent log makes the server look calm precisely when it is failing.
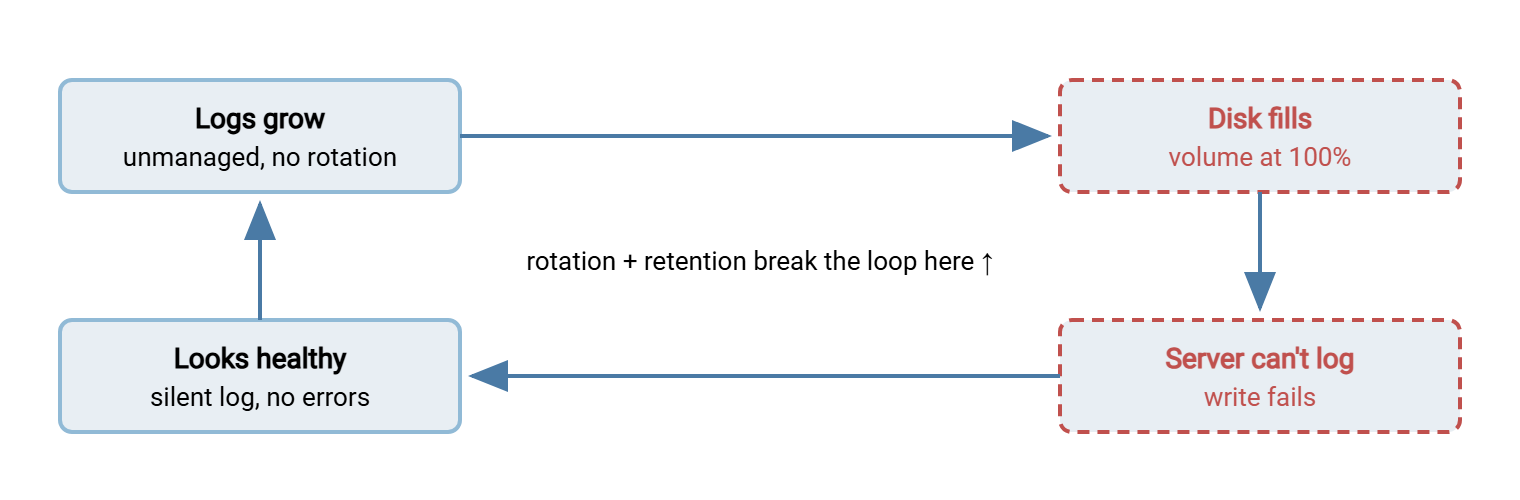
Break the loop at the first step. Rotation and retention stop the disk from filling. A disk alert with real runway (from the core metrics) catches it if rotation is misconfigured. The silent-log check below catches the case where everything else missed. Keep logs on their own volume, separate from transfer data and the system drive. That means even a runaway log takes down only logging — a contained failure instead of a total one.
The Silent Log: A Quiet Server Is Often a Sick One
Here is the counter-intuitive signal. A transfer server that normally writes hundreds of log lines an hour and now writes none is almost never idle. Genuine idleness is rare on a production server, and it looks different (occasional heartbeat lines, periodic health probes). A truly silent log usually means one of three things. The service has hung, the logging subsystem has failed, or the disk is full and writes are being dropped. All three are serious, and all three produce zero error lines, which is exactly why an error-rate alert alone will miss them.
The check is to watch the age of the newest log entry. If the most recent line is older than some expected interval — and you have accounted for genuinely quiet hours — alert. On Linux, compare the log's modification time against now:
#!/bin/sh
# alert if the log has not been written in over 20 minutes
LOG="/var/log/transfer/service.log"
AGE=$(( $(date +%s) - $(date -r "$LOG" +%s) ))
if [ "$AGE" -gt 1200 ]; then
  echo "WARN: log silent for $((AGE / 60)) minutes -- server may be stuck"
fi
This is the log equivalent of monitoring the monitor: the absence of data is itself data. Combine it with the synthetic login from the liveness article. If the log is silent and the synthetic login is failing, the service has hung. If the log is silent but the synthetic login still succeeds, the logging path itself has broken. That is the next problem. The one nuance to get right is the expected interval. Set it from the quietest genuinely-normal stretch of your week, not the busiest. Otherwise, the check will cry wolf every slow afternoon and get muted. That defeats the entire purpose of a silence alarm.
Log Write Failures
A log write failure is when the server tries to log and cannot. The disk is full, the log file's permissions changed, or the destination database is unreachable. This matters beyond the immediate. Many servers, sensibly, will refuse to perform an action they cannot record. So a broken logging path can start rejecting logins or transfers on the principle that an unlogged operation is worse than a refused one. A logging failure can thus masquerade as an authentication or transfer failure, sending you to debug the wrong layer.
Guard against it two ways. First, monitor the destination the logs are written to as carefully as the transfer data. Monitor its own disk, its own permissions, and for database logging, its reachability. Second, make sure the server has somewhere to complain when its primary log fails. A fallback to the operating system's event log or a secondary file means the failure of one logging path is itself logged somewhere. The what-to-log design decisions behind this live in what to log.
Database logging deserves special care here, because it introduces a dependency the file-based case does not have. The log now relies on a second service being reachable and healthy. When a server logs to a database, a slow or unreachable database can back up logging. In the worst case, it can stall the transfers that are waiting to record their own activity. The upside is real — a database makes logs queryable and centralizable. But the health view has to include the log database's own liveness, not just the transfer server's. Otherwise, you have simply moved the single point of failure somewhere less visible.
Sizing the Windows Event Log
On Windows, the server and the operating system also write to the Event Log. It has a size cap of its own that can quietly become a problem. Each event log is a fixed-size, self-rotating store. Once it reaches its maximum, it either overwrites the oldest events or, if configured to retain, stops accepting new ones. A cap set too small silently discards the events you needed; a retain-mode log that fills can block new writes.
Inspect the settings from PowerShell — the maximum size, the current file size, and whether it overwrites or retains:
PS> Get-WinEvent -ListLog Application |
>>   Select-Object LogName, MaximumSizeInBytes, LogMode, FileSize

LogName      MaximumSizeInBytes LogMode    FileSize
-------      ------------------ -------    --------
Application            20971520 Circular   18874368
LogMode of Circular means it overwrites the oldest events when full — the usual safe default, because it never blocks. A file size close to the maximum, as above, tells you events are turning over quickly. So if you need to keep them for audit you must forward them off the box before they roll away. Watch for service-level events that indicate trouble. Examples include an event logged when the system runs low on virtual memory or a resource-exhaustion event such as ID 1014. Treat a rising count of them the same way you treat a rising error rate in the transfer log. Centralizing and retaining these is again the centralizing logs topic.
Bringing It Together
Logs earn a place in the health view for three reasons at once. As a signal, a rising error rate warns you early. As a risk, unmanaged growth fills disks and causes outages that hide themselves. And as an instrument, a silent log tells you the server is stuck when nothing else will. Watch the error rate as a trend, and measure log-directory growth as days of runway. Rotate and retain so growth never becomes an outage. Alert on silence, and size the Windows Event Log so it keeps what you need.
Feed all of it onto the health dashboard as an error-rate tile and a log-growth line, sitting beside disk, sessions, and certificate days. For the governance half — what to log, how to read it, how long to keep it — the reading transfer logs article is the natural next stop.
Frequently Asked Questions
Why alert on the error rate instead of individual errors?
What is the difference between log rotation and retention?
Why is a silent log a warning sign?
How do logs cause a disk-full outage?
Can a logging failure cause transfers to fail?
How big should the Windows Event Log be?
From the Sysax team: we build secure file transfer software for Windows. Sysax Multi Server is an FTP, FTPS, SFTP, and HTTPS server. Sysax FTP Automation handles scheduled, scripted transfers. Free trials are on the download page.