
Finding the Bottleneck: Disk, CPU, Network, or the Far End
Some slow transfers have nothing to do with the network. The path is short, the link is wide and idle, and a file still takes twenty minutes that should take one. Somewhere in the chain — a disk, a processor, an interface, or the machine at the other end — one component is working flat out while everything else waits. The transfer runs at the speed of that one component, and until you find it, every setting you touch is a guess.
This article is the method for finding it: an isolation ladder that tests one component at a time. It runs from the machine alone up to the far end, so that each rung either clears a suspect or convicts it. We work it through on a realistic case — a nightly pull inside a data center that has slowed to a crawl — until the culprit is cornered. The commands and counters are shown with their output and what each number means. This is part of our Diagnosing Slow Transfers series. It assumes you have done the ten minutes of triage first and found that the network is not obviously to blame.
The Case
Every night at one o'clock, a transfer server pulls a 6 GB database export from an application server by SFTP. Both machines sit in the same data center, on the same gigabit network; the round trip between them is 0.4 ms. For months the job took about two minutes. The job history shows it now takes twenty-two: Mar 14 01:00 to Mar 14 01:22. That is 6,144 MB in 1,320 seconds, about 4.6 MB/s, on a link that can carry over 110. Triage cleared the obvious. The round trip is tiny, so latency is not it. The link is nearly empty at that hour, so bandwidth is not it. It is one big file, so protocol overhead is not it. Something in one of the two machines — or between them — is the bottleneck. The ladder finds which.
The Isolation Ladder
The principle is to measure the transfer with progressively more of the chain included, so that the rung where the speed collapses names the component. Rung one tests the machine alone: can it read and write the file to itself quickly? Rung two adds the transfer software and its encryption, still on one machine. Rung three tests the network alone, with no disks or encryption. Rung four is the far end, tested the same way from its side. The diagram shows the ladder and what each rung includes.
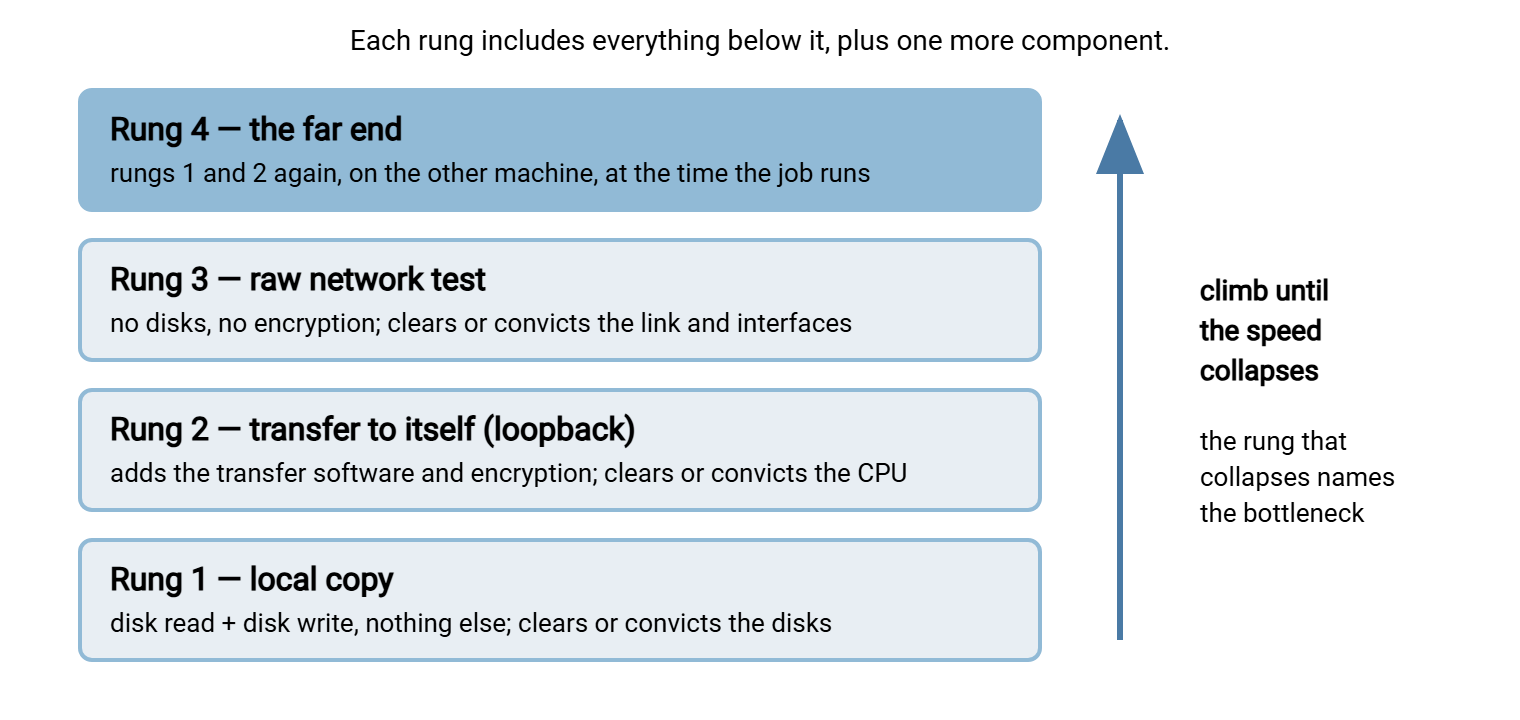
Two rules make the ladder work. Run each rung at the same hour the slow job runs, because a disk that is idle at noon may be saturated by a backup at one in the morning. And use the same file, or one of the same size and kind, at every rung, so the numbers compare.
Rung One: Can the Machine Move the File to Itself?
Copy the file from where the transfer reads it to another volume on the same machine, and time it. On the transfer server in our case, the destination volume is E:; copy the last export to a scratch folder there:
PS C:\> Measure-Command { Copy-Item E:\inbound\export.bak E:\scratch\export.bak }
...
TotalSeconds      : 58.7
Six gigabytes in 59 seconds is about 105 MB/s — the transfer server's disk can write far faster than the 4.6 MB/s the job achieves. Rung one clears this machine's disks. If the copy had taken ten minutes instead, the investigation would stop here and turn to the disk. There are three ways to see why a disk is slow.
First, understand what you are measuring. A disk has two speed limits. Throughput, in MB/s, is how fast it streams a large file in one piece — what a single big transfer needs. IOPS, input/output operations per second, is how many separate small reads or writes it can complete. That is what a transfer of thousands of small files needs, and what a database or a backup job consumes in bulk. A spinning disk might manage 150 MB/s of streaming but only a couple of hundred IOPS; a solid-state disk manages tens of thousands. A disk can be idle on one measure and saturated on the other.
Second, look at the disk's latency: how long each operation waits before the disk completes it. On Windows the counter is Avg. Disk sec/Transfer, readable from the command line:
PS C:\> Get-Counter '\PhysicalDisk(_Total)\Avg. Disk sec/Transfer','\PhysicalDisk(_Total)\Current Disk Queue Length' -SampleInterval 5 -MaxSamples 6

Timestamp                 CounterSamples
---------                 --------------
...  \\xfer01\physicaldisk(_total)\avg. disk sec/transfer   :  0.0031
...  \\xfer01\physicaldisk(_total)\current disk queue length :  1
The value is in seconds: 0.0031 is 3 ms per operation, which is healthy. Anything above about 20 ms sustained (a reading of 0.020 or more) means the disk is struggling. A queue length that stays above two or three means requests are piling up faster than the disk can clear them. The same counters are in Performance Monitor (perfmon) under PhysicalDisk. Resource Monitor's Disk tab shows which process is generating the load. That is how you catch a backup agent or an indexer reading the same volume during the transfer window.
On Linux, iostat -x 5 (from the sysstat package) prints the equivalent every five seconds; the exact columns vary by version, but three matter:
$ iostat -x 5
Device      r/s     w/s   rkB/s   wkB/s  r_await  w_await  %util
sda        12.0   410.0   480.0 52480.0     2.1     41.8   99.6
r_await and w_await are the average wait per read and write in milliseconds — 41.8 ms for writes here is bad. %util is the share of time the disk was busy; 99.6 means saturated. And wkB/s shows it is only writing about 51 MB/s while saturated. On a spinning disk, that is the signature of scattered small writes rather than one clean stream. Someone else is using this disk.
Third, a slow local copy can be the fault of software rather than hardware. An on-access antivirus scanner reads every byte written, and on a busy transfer volume that can halve write speed. Do not switch it off to test; instead compare the copy to a folder the scanner is configured to exclude, or ask the security team which folders are excluded. Where scanning fits into a file flow covers the sensible placements.
Rung Two: What Does Encryption Cost?
Now add the transfer software. Run an SFTP transfer of the same file from the machine to itself, over its own loopback address, 127.0.0.1. This connection never touches a network cable, so what remains is the protocol and its encryption. Every byte is encrypted by one process and decrypted by another on the same machine, which is a fair stand-in for one side of a real transfer:
$ sftp svc_xfer@127.0.0.1
sftp> put /srv/scratch/export.bak /srv/scratch/loop/export.bak
Uploading export.bak to /srv/scratch/loop/export.bak
export.bak      100%   6144MB  71.2MB/s   01:26
Seventy-one megabytes a second — slower than the raw copy, as it should be, but fifteen times faster than the job. Rung two clears this machine's CPU and its SFTP stack. Had this run at 5 MB/s, the machine's processor would be the suspect. The way to confirm that suspicion is to watch the CPU per core during the transfer.
That last phrase is the trap. Encryption of a single connection runs on a single core. A four-core server whose overall CPU reads "25 percent busy" may have one core pinned at one hundred percent and three idle. In that case, the transfer is limited by that one core, however comfortable the average looks. In Task Manager, open the Performance tab, select CPU, right-click the graph, and change it to show logical processors. From the command line, ask for every core rather than the total:
PS C:\> Get-Counter '\Processor(*)\% Processor Time' -SampleInterval 2 -MaxSamples 3

...  \\xfer01\processor(0)\% processor time       :  98.4
...  \\xfer01\processor(1)\% processor time       :   3.1
...  \\xfer01\processor(2)\% processor time       :   2.7
...  \\xfer01\processor(3)\% processor time       :   4.0
...  \\xfer01\processor(_total)\% processor time  :  27.1
On Linux, run top and press 1. The summary expands to one line per core. A line such as %Cpu0 : 98.0 us beside three near-idle cores tells the same story. Resource Monitor's CPU tab, or top's process list, then names the process — the SSH daemon, the transfer service — so you know the encryption is what is burning it.
If one core is pinned, the choice of cipher — the encryption algorithm the session negotiated — is the first thing to check. Modern processors accelerate AES in hardware, and an AES-based cipher on such a machine encrypts hundreds of megabytes per second per core. An older cipher, or a software-only one on a virtual machine that has not been given the acceleration feature, can be several times slower. Test it directly on the loopback: repeat the transfer while forcing a cipher with the client's -c option, and compare rates. Cipher policy basics explains which ciphers are sensible to allow, and SFTP performance goes deeper into what SFTP costs and why.
Remember: "CPU is only at 25 percent" clears nothing until you have looked per core. A single encrypted connection lives on one core, and one saturated core is a full-blown bottleneck that the average hides completely.
Rung Three: The Network Alone
With the machine cleared, test the link between the two machines with nothing on it but a raw stream. Run iperf as described in latency or bandwidth?, from the application server to the transfer server. In our case it reports 941 Mbit/s — the link is essentially perfect. Rung three clears the network.
When it does not, two cheap checks come before anything elaborate. The first is the interface's negotiated speed. A gigabit port that has negotiated at 100 Mbit/s, or a half-duplex link, is a classic cause of a server that is "fine" until it is asked to move data in bulk. On Windows, Get-NetAdapter lists each adapter with its LinkSpeed; on Linux, ethtool eth0 shows Speed: and Duplex:. A mismatch between what the port should be and what it is usually means a bad cable or a switch port pinned to a fixed setting.
The second is the interface's actual load. Get-Counter '\Network Interface(*)\Bytes Total/sec' on Windows, or sar -n DEV 5 on Linux, shows how busy each interface is; Resource Monitor's Network tab breaks it down by process. An interface running near its ceiling while your transfer gets a sliver means something else on the server is using the link. That might be a replication job, a backup, or a monitoring agent shipping logs. In that case, the fix is scheduling rather than tuning.
Rung Four: The Far End
Every rung so far has cleared the transfer server and the link. That leaves the application server. The honest position is that you cannot see inside a machine you do not administer — you can only infer, or ask. Inference first: does the same server deliver files quickly to anyone else at that hour? Is only this one file slow, or every file from that server? Does the slowness begin at exactly the time some other job starts? The transfer server's own logs help here. A server that records session start and end times per connection, as Sysax Multi Server does, lets you line the slow window up against whatever else the calendar says was running.
Then ask. The request to the application server's owner is not "your server is slow" but "please run rungs one and two on your side at one in the morning." In our case the application team obliged, and rung one told the story on its own:
appdb01, Mar 15 01:05
$ time cp /var/exports/export.bak /tmp/export.bak
real    19m41.2s

$ iostat -x 5
Device      r/s     w/s   rkB/s   wkB/s  r_await  w_await  %util
sdb       210.0   380.0  5100.0 48200.0    38.4     52.7   100.0
The local copy takes almost twenty minutes, on a disk showing one hundred percent utilization with waits of 40 to 50 ms per operation. It is writing only 48 MB/s. The far end's disk is saturated by something else. Resource Monitor's equivalent on Linux, iotop, named it: a database backup. It had been rescheduled the previous month from eleven at night to one in the morning. It was now running on the same disk at the same moment the transfer tries to read the export. The transfer was getting whatever the disk had left over, about 4.6 MB/s, and the "slow SFTP" ticket was never about SFTP at all.
The Case, Cornered
Laid end to end, the ladder reads like this:
| Rung | Test | Result | Verdict |
|---|---|---|---|
| 1 — transfer server | Local copy, 6 GB | 59 s, 105 MB/s; disk latency 3 ms | Disks cleared |
| 2 — transfer server | SFTP to loopback | 86 s, 71 MB/s; one core at 70 percent | CPU and SFTP stack cleared |
| 3 — the link | Raw stream, app server to transfer server | 941 Mbit/s; interfaces at 1 Gbit full duplex | Network cleared |
| 4 — application server | Local copy at 01:05 | 19 min 41 s; disk 100 percent busy, 50 ms waits | Bottleneck: far end's disk, contended by a backup |
The remedy was scheduling, not tuning. The export is now written at half past eleven and pulled at midnight, before the backup begins. The job is back to two minutes. Notice what would have happened without the ladder. The transfer server would have been rebuilt, the cipher changed, and the network team engaged. The job would still have taken twenty-two minutes, because nothing on that list was the problem.
A Worksheet for the Ladder
Copy this into the ticket and fill in the right-hand column as you climb. The "healthy" figures are for a gigabit LAN with a single large file; scale your expectations to your link, and for many small files expect every number to be lower.
| Rung | Command or counter | Healthy looks like | Yours |
|---|---|---|---|
| 1 Disk | Measure-Command { Copy-Item } / time cp; Avg. Disk sec/Transfer / iostat -x await |
100 MB/s or more; latency under 10 ms; queue under 2 | |
| 2 CPU | Transfer to 127.0.0.1; Processor(*)\% Processor Time / top then 1 |
Within a factor of two of rung 1; no core pinned near 100 percent | |
| 3 Network | iperf between the two hosts; Get-NetAdapter / ethtool; interface bytes/sec |
Over 90 percent of rated speed; full duplex at the rated speed; interface not already busy | |
| 4 Far end | Rungs 1 and 2 on the other machine, at the job's hour | Same as above |
Gotcha: the ladder tests one transfer. A server that passes every rung for a single session can still be slow when fifty partners connect at once. That is because fifty encrypted sessions need fifty cores' worth of cipher work and fifty disks' worth of IOPS. If the complaint is "everything is slow when it is busy," the question is capacity, and server capacity and concurrency is the series for it.
The Method Beyond This Case
The ladder generalizes. Whatever the symptom, measure the machine alone, then the machine plus its software, then the link alone, then the other machine. The rung where the number collapses is the answer. The ladder takes half an hour and needs no tools beyond what the operating systems ship with plus iperf. It produces evidence rather than opinion, which is what you need when the fix belongs to another team. Keeping an eye on the same counters continuously, so a saturated disk is noticed before a ticket arrives, is the subject of transfer server health monitoring.
If the ladder clears both machines and the link but the job is still slow, the remaining suspects are the shape of the data and the path between the ends. That means many small files paying a per-file tax, or a device in the middle slowing traffic it does not like. Those are the next two articles: when the protocol is the problem and slowdowns along the path. And once you know which component is the limit, the series closes with the remedies for each one, ranked by how much effort they take.
Frequently Asked Questions
The server's CPU graph shows 30 percent. Can encryption really be the bottleneck?
What is the difference between disk throughput and IOPS?
My local copy was fast the second time I ran it. Which number do I trust?
How do I test the far end when I have no access to it?
Does the ladder work for uploads as well as downloads?
From the Sysax team: we build secure file transfer software for Windows. Sysax Multi Server is an FTP, FTPS, SFTP, and HTTPS server. Sysax FTP Automation handles scheduled, scripted transfers. Free trials are on the download page.