
Slow Transfer Triage: The First Ten Minutes
"The transfer is slow." That sentence arrives by ticket, by chat, or over a partition, and it almost never comes with a number attached. Slow compared to what? Slow since when? Slow for everyone or for one job? The temptation is to start changing things — a buffer here, a setting there — and hope the complaint goes away. It usually does not, because there are at least six different reasons a transfer can be slow, and each has a different fix.
This article is the first ten minutes of a slow-transfer investigation done properly. It covers turning "slow" into a measured rate and working out what rate you were entitled to expect. It covers the five facts to write down before touching anything, and four quick tests that eliminate most of the candidate causes on the spot. Every term is explained as it appears. If you have never calculated a throughput or read a ping summary, you will be able to by the end. This is part of our Diagnosing Slow Transfers series; the articles that follow each take one suspect and corner it.
First, Turn "Slow" Into a Number
The only useful description of a slow transfer is a rate: how much data moved, divided by how long it took. That rate is called throughput — the data that actually arrives per second, as opposed to the speed the link is theoretically capable of. Throughput is what the user feels; everything else is a cause.
Take a concrete case we will follow through this article. A nightly job uploads a 2 GB archive to a partner's SFTP server. The job log says it started at Mar 14 02:10 and finished at Mar 14 02:24: fourteen minutes, or 840 seconds. Two gigabytes is 2,048 megabytes, so the throughput was 2,048 ÷ 840, about 2.4 megabytes per second.
Now the trap that catches almost everyone once. Network links are quoted in megabits per second (Mbit/s); files and transfer clients are quoted in megabytes per second (MB/s). One byte is eight bits, so multiply megabytes by eight to compare: our 2.4 MB/s is about 19.5 Mbit/s. If someone says "the link is 100 meg" and the client shows "12 MB/s," both describe the same, nearly full pipe. Write the units down every time; half of all slow-transfer confusion is a factor of eight hiding in a unit.
size:        2 GB  = 2,048 MB
elapsed:     02:10 to 02:24  = 14 min  = 840 s
throughput:  2,048 MB / 840 s  = 2.4 MB/s
in bits:     2.4 MB/s x 8  = 19.5 Mbit/s
Get the size and time from logs, not memory. Server-side, a transfer server that keeps activity logs gives you both ends of the calculation without asking the user anything. Sysax Multi Server logs each session's activity with timestamps. Client-side, a scheduled job's history usually has the same data. Our guide to reading transfer logs shows where those fields live.
Then Decide What "Fast" Would Have Been
A rate on its own means nothing. 2.4 MB/s is excellent across a satellite link and terrible across a data-center switch. You need an expectation to compare against, and there are three sources of one.
The link ceiling
The bandwidth of a link is the maximum rate at which bits can be pushed onto it — the width of the pipe. A 100 Mbit/s link can carry at most 12.5 MB/s. In practice, protocol packaging (headers on every packet, acknowledgements traveling the other way) eats about five percent. So a single healthy transfer on an idle 100 Mbit/s link tops out around 11.5 to 12 MB/s. That is the ceiling; no setting anywhere will beat it. Our 2 GB file at 12 MB/s would take about three minutes. It took fourteen — roughly one fifth of what the pipe allows. That is a real problem, not a perception. The ceiling that counts is the narrowest link anywhere in the path: the office connection, the partner's connection, or a VPN tunnel with its own limit.
The historical baseline
The second expectation is "what it did last week." A job that used to finish in three minutes and now takes fourteen has changed, and something changed it. A job that has always taken fourteen minutes may simply be running at the speed the path permits. In that case, the "slowness" is a new expectation rather than a new fault. Pull the last few weeks of timings from its logs; a table of dates and durations settles it in seconds. The distinction matters: a job that got slower has a cause you can find. A job that was always this slow needs a remedy, which is a different search.
The distance ceiling
The third expectation is the one junior administrators are rarely told about. It explains a large share of "the link is 100 meg but I only get 20" tickets. Networks have a second property besides width: latency, the time a packet takes to travel from one end to the other. Measured there and back it is the round trip time (RTT): well under a millisecond on a local network, commonly 30 to 80 milliseconds across a country, 100 to 200 across an ocean.
Here is why that matters, in one plain paragraph. TCP, the transport underneath FTP, SFTP, FTPS, and HTTPS, sends a chunk of data and then waits for the receiver to confirm it arrived before sending more. That chunk is the window. One connection cannot move more than one window per round trip, so its maximum throughput is window ÷ RTT. Turn that around and you get the bandwidth-delay product: bandwidth × RTT is how much data must be "in flight" to keep the pipe full. On a 100 Mbit/s link with a 40 ms RTT, that is 100 Mbit/s × 0.04 s = 4 Mbit, about 500 KB. If the window is smaller, the link cannot be filled however wide it is. A window of 64 KB was the default for a very long time, and still appears on old systems and through some middleboxes. With that window, 64 KB ÷ 0.04 s = 1.6 MB/s. That is the distance ceiling; the full physics is in our bandwidth-delay product article.
Look at our example again: 2.4 MB/s on a 40 ms path is what a window of roughly 100 KB would produce. That is a strong early hint that this transfer is limited by distance, not pipe width. Telling latency from bandwidth confirms or rejects the hint.
Remember: a transfer has three ceilings — the pipe, the history, and the distance. Work out all three before you change a single setting. A transfer that is already at one of its ceilings is not broken; it is at its limit, and the remedy is different from a repair.
The Five Facts to Collect Before Touching Anything
Ten minutes of fact-gathering saves hours of guessing. Copy this worksheet into the ticket and fill it in before running any test or changing any setting. Each row rules candidates in or out.
| Fact | Where to get it | Why it matters |
|---|---|---|
| Size and shape — total bytes, number of files, largest and smallest | Job log, directory listing | One big file and ten thousand small ones behave completely differently on the same link |
| Elapsed time — start and end timestamps | Server activity log, job history | Gives the throughput; shows whether time went into transferring or into waiting first |
| The path — source, destination, which networks, VPN or proxy in between | Job configuration, network diagram, tracert/traceroute |
Sets the link and distance ceilings; names the devices that could be slowing it |
| When it changed — always this slow, or since a date; all day, or only at certain hours | Job history over several weeks; change records | Separates a fault (something changed) from a limit (always so); time-of-day patterns point at congestion |
| Who else — one user, one job, one server, or everyone; upload, download, or both | Other tickets, other jobs' timings, a colleague's quick test | One slow job among fast ones points at that job's shape or endpoint; everything slow points at the shared link or server |
The "when it changed" row deserves emphasis. Ask for the exact date and what else happened that week: a firewall upgrade, a new VPN client, a server patch, a new backup job at the same hour. Slow transfers that begin on a date almost always have a cause that began on the same date, and the change log finds it faster than any network tool.
The Candidate Bottlenecks
A transfer is a chain. Bytes are read from a disk, encrypted by a CPU, and pushed onto a network. They are carried across routers and possibly proxies and firewalls. They are received, decrypted by another CPU, and written to another disk. Any link in that chain can be the slow one, and the whole transfer runs at the speed of the slowest. The diagram below lays the chain out with the six places time is most often lost.
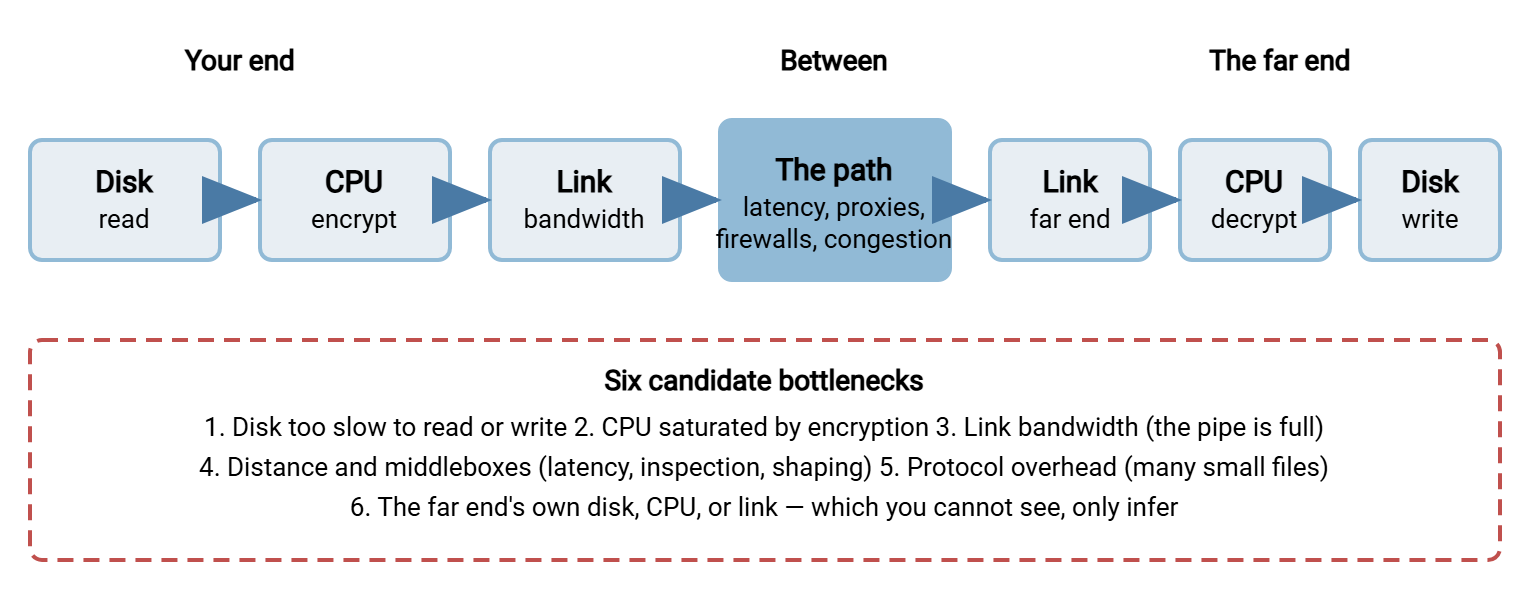
In plain terms, the six suspects are:
- Bandwidth — the pipe is full, because it is narrow or because something else is using it.
- Latency — the path is long and the window small, so the connection spends its life waiting for acknowledgements.
- Disk or CPU at either end — the machine cannot read, encrypt, decrypt, or write fast enough.
- Protocol overhead — thousands of small files, each costing several round trips before a payload byte moves.
- The path — a proxy, inspection device, VPN, or congested hour slowing the middle.
- The far end — the partner's server, which you cannot measure directly, only infer by clearing everything else.
The Four Quick Tests
These four tests take a few minutes each, need no special tools, and between them eliminate most of the suspects. Run them in order and write each result on the worksheet.
Test 1: measure the round trip
ping sends a tiny packet to a host and times the reply — the simplest possible latency meter. Windows sends four packets by default; ask for ten so the summary means something:
C:\> ping -n 10 sftp.partner.example.com

Reply from 198.51.100.20: bytes=32 time=41ms TTL=52
Reply from 198.51.100.20: bytes=32 time=39ms TTL=52
Reply from 198.51.100.20: bytes=32 time=47ms TTL=52
...
Ping statistics for 198.51.100.20:
    Packets: Sent = 10, Received = 10, Lost = 0 (0% loss),
Approximate round trip times in milli-seconds:
    Minimum = 39ms, Maximum = 47ms, Average = 41ms
On Linux or macOS, ping -c 10 sftp.partner.example.com prints one line per reply and a summary like rtt min/avg/max/mdev = 39.1/41.3/47.0/2.1 ms. Three numbers matter. The average is your RTT for the ceiling calculation. A wide spread between minimum and maximum (jitter) hints at congestion — a path whose minimum is 39 ms and maximum 140 ms is queuing somewhere. And loss, any packet that never came back, is a red flag on its own. TCP treats loss as a signal to slow down sharply, so even one percent loss can halve a transfer's speed.
Two cautions. Some hosts and firewalls block ping. A timeout means this probe is refused, not that the path is dead, so ping the nearest hop that answers instead. And a healthy ping proves the path is short and clean; it says nothing about how wide it is.
Test 2: time a local copy
Before blaming the network, check that the machine can move the file to itself quickly. Copy the file to another disk on the same machine and time it:
PS C:\> Measure-Command { Copy-Item D:\outbound\archive.zip E:\scratch\ }

Days              : 0
Hours             : 0
Minutes           : 0
Seconds           : 18
Milliseconds      : 412
...
TotalSeconds      : 18.412

$ time cp /srv/outbound/archive.zip /scratch/
real    0m17.9s
Two gigabytes in eighteen seconds is about 114 MB/s — the disks are not the problem here, since the network ceiling is 12 MB/s. If instead the local copy took several minutes, you have found your bottleneck without touching the network. The bottleneck is a struggling disk, an antivirus scanner reading every byte, or a nearly full, fragmented volume. One caveat: operating systems cache recently read files in memory, so a second copy of the same file can look unrealistically fast. Use a file you have not touched recently, or one larger than the machine's memory.
Test 3: change the shape
If the slow job moves many files, transfer one large file of similar total size over the same connection and compare. If the big file runs at five times the rate of the small-file set, the network is fine and the shape is the problem. In that case, per-file overhead is eating the time. If both are equally slow per byte, shape is not the issue. This five-minute test has a high payoff, because small-file overhead is one of the most common causes of "slow" and one of the least suspected.
Test 4: change the vantage point
Run the same transfer, same file, same protocol, from a machine on the same network as the server. Ideally, use the server itself, transferring to its own address, or a neighbor on the same subnet. This is the first rung of the isolation ladder. If the transfer is fast from beside the server and slow across the WAN, every suspect inside the server is cleared. In that case, the problem lives on the path. If it is slow even from beside the server, the path is cleared and the problem is the server, the protocol, or the disk. The full ladder — server, subnet, WAN, far end — is worked through in finding the bottleneck.
Run tests 3 and 4 with a client that reports its own rate. Graphical clients show a live figure, curl prints an average on completion, and a scheduled-transfer product's job log records bytes and duration per file. Compare like with like — same file, same protocol — or the comparison proves nothing. Anything more elaborate is benchmarking, and why transfer benchmarks lie lists the ways a casual speed test misleads.
Gotcha: run the quick tests at the hour the slow job runs. A path that is empty at ten in the morning and jammed at two in the morning by everyone's backups will pass every daytime test and fail every night.
Reading the Results
With the worksheet and four test results in hand, the pattern usually points at one suspect. This table maps common patterns to the likely bottleneck and the article that finishes the job.
| What you saw | Most likely cause | Next step |
|---|---|---|
| Rate near the link ceiling; a second transfer halves the first | Bandwidth — the pipe is full | Schedule, throttle, or widen: bandwidth management |
| RTT of 30 ms or more; rate far below ceiling but matches window ÷ RTT; link otherwise idle | Latency-bound | Latency or bandwidth? |
| Local copy slow, or a CPU core pinned during transfer | Disk or CPU at one end | Finding the bottleneck |
| One big file fast; many small files slow | Protocol overhead | Overhead and small files |
| Fast beside the server, slow across the WAN; or slow only at certain hours | The path — middlebox or congestion | Slowdowns along the path |
| Everything on your side healthy; only this partner slow | The far end | Send the partner your worksheet and ask for theirs |
Two patterns fall outside this series. If everything is slow for everyone all the time and the server's own copy test is slow, the server may have outgrown its hardware or connection limits. See server capacity and concurrency. And if the transfer stalls rather than crawls — the rate drops to zero for stretches, or the session drops and resumes — timeouts and dropped sessions is the place to look.
Handing the Case Onward
Ten minutes in, you should have a measured throughput with units, the three ceilings to compare it against, a filled worksheet, four test results, and a leading suspect. That is a diagnosable case, and exactly what a network team or a partner needs if the problem turns out to be theirs. A ticket that says "2 GB in 14 minutes, 41 ms RTT, 100 Mbit link, local copy fine, fast from the server's subnet, slow since the VPN upgrade on the twelfth" gets action; "SFTP is slow" gets a shrug.
For our worked example, the trail points one way. We have healthy disks, a clean 41 ms round trip, and a rate that matches a small window over that distance. We also have a date that coincides with a VPN change. The next article, latency or bandwidth?, runs the three tests that prove it. If your case pointed elsewhere, finding the bottleneck takes the endpoint suspects and slowdowns along the path takes the middle. And if the transfer is failing rather than crawling, our troubleshooting failed transfers series applies the same discipline to breakage.
Frequently Asked Questions
My link is 100 Mbit/s but the client only shows 12 MB/s. Is something wrong?
What is a "normal" ping time?
Why do I need to know whether the job was always slow?
The local copy test was fast. Does that clear the server completely?
Ping is blocked to the partner's server. How do I measure the round trip?
From the Sysax team: we build secure file transfer software for Windows. Sysax Multi Server is an FTP, FTPS, SFTP, and HTTPS server. Sysax FTP Automation handles scheduled, scripted transfers. Free trials are on the download page.