
Why Most Transfer Benchmarks Lie (and How to Make Yours Honest)
"The new server does a hundred and ten megabytes a second." I have heard that sentence in a dozen meetings, always from someone who had measured it. Three weeks later the nightly job to a partner is slower than on the old server. The same person cannot reconcile the two. Both numbers were measured. Neither was a lie. The first one simply answered a question nobody had asked.
A benchmark is a measurement made under stated conditions, so that it can be compared with another made under the same conditions. Most transfer benchmarks fail on the "stated conditions" half. They measure something real (a cached file, one lucky run, a single big file on a quiet LAN). They quote the result as if it applied to every file, every link, and every night of the year. This article is a catalog of those distortions, with a fix for each. It is the foundation of our Benchmarking Transfer Performance series.
The physics underneath (latency, bandwidth-delay product, TCP tuning) lives in our acceleration series, linked where it applies. Here the subject is the measuring instrument. By the end you will know which questions to ask before believing anyone's number, including your own.
A Benchmark Is a Claim With Conditions Attached
Three words carry most of the confusion. Throughput is a rate: bytes moved per second. Latency is a delay: the time for a packet to reach the other end and a reply to come back. This is called the round-trip time or RTT. Wall-clock time is what a clock on the wall shows between the start of a job and its finish. A benchmark result is a claim of the form "under conditions C, job J took time T." Strip out C and the claim means nothing. Strip out J and it means even less.
"A hundred and ten megabytes a second" has neither. Which file? Which link? Which run, the first or the fifth? Which stopwatch, the client's progress meter or a clock started when the scheduler fired? Every distortion in this article is a way of quietly dropping one of those conditions. I once saw a vendor chart with one tall bar labeled "up to" and a vertical axis labeled nothing at all. That at least dropped them all at once.
Distortion zero is units. Links are sold in megabits per second; files are measured in megabytes, and eight bits make a byte. A gigabit link carries about 125 megabytes per second raw and roughly 110 to 118 in practice. A 100 megabit link tops out around 11. When a report says "we only got 11 on a 100 meg link," the link was full. It had been full the whole time. State the units and do the division once.
Where the Measurement Goes Wrong
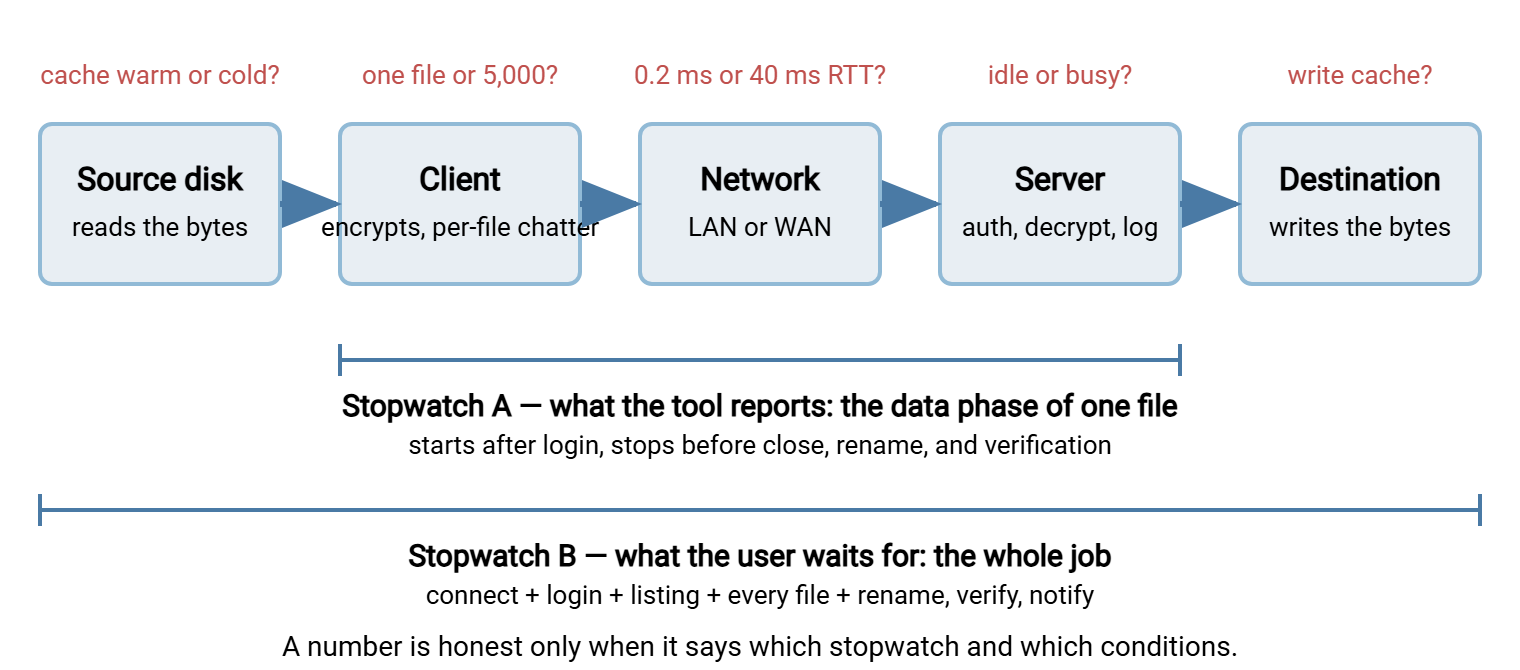
The diagram below follows a file from source disk to destination disk. Above each stage is the question that most often goes unasked. Below the path are the two stopwatches people confuse. The tool's timer covers only the data phase. The user's covers the whole job.
The Distortion Catalog
1. The warm cache
Operating systems keep recently read file data in spare memory, the page cache. The first time a file is read it comes from disk at disk speed. The second time it comes from RAM, which is faster than any network. The symptom: the first run is noticeably slower than the rest, and the report quietly retires it as a "warm-up."
Neither number is wrong; they answer different questions. A nightly export written minutes before it is sent may still be in cache when the job runs. A month-old archive on a busy file server will not be. Decide, deliberately, whether you are measuring cold or warm, and say so. For cold runs, use files larger than the machine's memory, generate fresh files before each run, or clear the cache. On Linux, use sync then a write to /proc/sys/vm/drop_caches. On Windows, use a fresh file or a reboot. For warm runs, read the file once first, and say so.
2. The destination's write cache
The same trick works in reverse at the far end. A server acknowledges data once it is in memory or in the disk controller's cache, not once it is on the platters. So a short test can finish entirely inside that cache and look faster than the disk could ever sustain. The symptom is a benchmark that looks wonderful with 500 megabyte files and terrible with 20 gigabyte ones. The fix is duration and size: a minute or more of sustained writing, with files large enough to exceed the cache. Measure the destination disk alone with a plain local copy, too. If it cannot write faster than 80 megabytes a second, no protocol will deliver 110 for long.
3. Single-run noise
One run is an anecdote. Between two identical runs a backup can start, the antivirus scanner can wake up, a switch can drop packets, a DNS lookup can stall. A single measurement carries all of that invisibly. One run quoted to two decimal places is an anecdote in a lab coat.
The fix is repetition, and the rule is short. Run each test at least five times. Report the median (the middle value when the runs are sorted) and the spread, the fastest and slowest runs. Five runs of 41, 43, 42, 58, and 42 seconds are "a median of 42 seconds, spread 41 to 58." The 58 is worth a look, not a deletion. A difference smaller than the spread is not a difference: medians of 42 and 45 with overlapping spreads are a tie.
4. The wrong file mix
Every file pays a fixed cost that has nothing to do with its size. That cost includes a request to open it, a reply, its attributes, and a close. For some protocols it also includes a fresh connection and a handshake. That is per-file overhead. One 2 gigabyte file pays it once. Five thousand files of 100 kilobytes pay it five thousand times. The payments add up to more time than the bytes themselves. The bytes are the cheap part. The paperwork is the job.
The symptom is a benchmark with one large file quoted for a job that moves thousands of small ones. The fix is to benchmark your actual mix. List the real folder, count the files in each size band, and build a test set with the same shape. Report files per minute alongside megabytes per second; for a small-file job the first number predicts the finish time. Our article on the many-small-files problem explains why. The article on protocol overhead and small files shows how to tell that overhead from a slow link.
5. LAN numbers quoted for WAN decisions
On a LAN the round-trip time is a fraction of a millisecond. Across a WAN it is tens of milliseconds. Every exchange that needs a reply (each per-file request, each acknowledgment a TCP connection waits for) costs a hundred times more. A single connection can keep only so much data in flight before it pauses for acknowledgments. On a long link that pause can leave most of the bandwidth idle. Our article on the bandwidth-delay product explains the arithmetic. The article on latency versus bandwidth diagnosis shows which of the two is holding your job back.
The symptom is a test between two machines in the same rack, used to predict a job to a partner three countries away. (The rack did very well.) The fix is to test on the real link, from where the real client sits. If that is impossible, add artificial delay with your operating system's traffic-shaping tools and say so. Either way, measure the RTT with a few dozen ping samples and write it next to the result.
6. Measuring one file instead of the whole job
A job is not a file. A job is: the scheduler fires, then the client connects, logs in, and lists a directory. The client transfers each file and renames each from its temporary name. Perhaps it verifies a checksum. Perhaps it sends a notification. The tool's progress meter covers one step in the middle. The symptom is the classic complaint: "the transfer takes twenty seconds, but the job takes four minutes."
The fix is to time from trigger to usable with a clock outside the tool. Server logs with timestamps give you the same job from the far end. Sysax Multi Server writes its activity log to a file or a database. It records the login and the completion of each transfer. What users experience is the subject of measuring what users feel.
7. Reported throughput versus wall clock
The "MB/s" a client prints is its own calculation: bytes divided by the time it chose to count. Usually it counts the data phase only. Sometimes the rate is smoothed over the last few seconds, and occasionally it is the peak rather than the average. Compute your own rate from bytes you know and seconds you measured:
# Linux/macOS: wall clock for a scripted SFTP batch
time sftp -b upload_batch.txt bench@xfer-test.example.net

# Windows PowerShell: wall clock for a whole job script
Measure-Command { & .\run-nightly-upload.ps1 } | Select-Object TotalSeconds

# HTTPS: curl's own timing breakdown
curl -o NUL -s -w "connect %{time_connect}  first byte %{time_starttransfer}  total %{time_total}  bytes %{size_download}\n" https://files-test.example.net/bench/big_random.bin

# rate = total bytes / wall-clock seconds
Use the tool's meter to watch progress. Use your own division to report a result.
8. The quiet lab and the busy night
Benchmarks are run at two in the afternoon on idle hardware. Jobs run at two in the morning next to the backup, the database maintenance, and everything else scheduled for "when nobody is using the system." That is now the busiest hour of the day. The symptom is a server that benchmarks beautifully and misses its cutoff every night. The fix is to measure in the real window at least once. Note the load every time: CPU, disk queue, and what else was running. If you can only measure at idle, say so. An honest idle number is useful, and an idle number presented as a nightly prediction is not. Behavior under many jobs at once is a different test, covered in load testing a transfer server.
9. Unequal configuration
Comparisons between protocols or products are often comparisons between one side somebody tuned and one side left at defaults. One client pipelines requests and the other waits for each reply. Compression is on for one and off for the other. One landing folder is scanned by antivirus and the other is not. The result measures the configuration, not the thing compared. The fix is a parity checklist worked through before any run, the subject of comparing protocols fairly.
10. Encryption blamed, or ignored
Told straight: encryption costs something, and on modern hardware it is usually not the bottleneck. Processors have hardware support for the common ciphers. They encrypt at many hundreds of megabytes per second per core, far above a gigabit link. The cost is measurable (a few percent of CPU on each end, a handshake at connection time). But a plain-text transfer that ran at 110 does not become 40 because it was encrypted.
The symptom, in one direction, is a slow transfer blamed on "the encryption" when the cause is per-file overhead or a full link. In the other, it is a comparison that ignores the small, real cost on an old or overloaded server. Or it ignores that cost on a ten-gigabit link where the CPU genuinely can become the limit. The fix is to watch CPU during the run. If a core is pinned, the cipher matters; if not, look elsewhere. Never weaken a cipher policy for a benchmark; see our cipher policy basics.
11. Cherry-picking
The best of five runs, quoted alone, is the oldest trick in the catalog and often an innocent one. I have done it myself, sincerely believing the best run was the "true" speed with the noise removed. It is not. The fix is a habit: keep every run, report the median and spread, and store the raw numbers where a colleague can find them.
Remember: a benchmark result without the file mix, the link, the cache state, the stopwatch, and the number of runs is not a result. It is a number that happened once.
One Server, Five Honest Numbers
Take one ordinary server on a gigabit LAN, with a 100 megabit WAN link to a partner site 40 milliseconds away. Measure it five ways. Each result is a median of five runs; spreads were within about five percent on the LAN and ten percent on the WAN.
| Test | Result | What it actually measured |
|---|---|---|
| One 2 GB file, LAN, warm cache | About 20 seconds, roughly 100 MB/s | The network's ceiling |
| One 2 GB file, LAN, cold source disk | A little over half a minute, roughly 60 MB/s | The source disk, shared with other work |
| 5,000 files of 100 KB (500 MB), LAN, one connection | About 80 seconds, roughly 6 MB/s | Per-file overhead, about 15 ms per file |
| One 2 GB file, WAN, 100 Mbit/s, 40 ms RTT | About 3 minutes, roughly 11 MB/s | The link's capacity — it was full |
| 5,000 files of 100 KB, WAN, one connection | About 12 minutes, under 1 MB/s | Round trips per file multiplied by 40 ms |
Which of these is "the speed of the server"? All of them, and none. The first row is what a brochure would print. The last row is what the partner feed will feel like. Same hardware, same software, numbers more than a hundred to one apart, and every one honest as long as its row label travels with it. Notice what the WAN rows say. The big file filled the link, so no tuning will speed that row up. The small files left the link mostly idle, so parallel connections or less per-file chatter would help enormously. That distinction, full link versus idle link, is the one our article on whether you need acceleration builds on.
Northgate Retail learned the table the expensive way. They chose a new transfer server on one figure in the proposal, "sustained 110 MB/s." The figure was true: one large file, on a LAN, cache warm, best of three. Their nightly job moved tens of thousands of small store receipts across a 20 millisecond link. On the new server it finished eleven minutes later, because the old client pipelined its requests and the new one did not. The meeting to explain why ran longer than the eleven minutes. Nobody in it had asked about the file mix before signing.
The Principles of an Honest Benchmark
Every fix in the catalog reduces to a short list of habits that produce numbers a skeptical colleague can check.
- Write the question first. "Will the export job be slower over SFTP than over FTPS?" is a question a benchmark can answer. "How fast is the server?" is not.
- Measure the job, not a file. Trigger to usable at the far end.
- Use your own stopwatch.
time,Measure-Command, or server log timestamps, and your own division. - Match the real file mix. Sample the real folder; report files per minute as well as megabytes per second.
- Test on the real link, or say you did not. Record the measured RTT either way.
- Decide cold or warm, and say which.
- Repeat five times. Median and spread; differences inside the spread are ties.
- Keep the two sides equal. Same hardware, files, tuning, scanning, and compression setting.
- Record the load on both ends.
- Keep the raw runs, every one, where someone else can find them.
The cheapest way to honor most of these habits at once is to write the conditions down before the first run. Use a block that travels with the results:
BENCHMARK   nightly-export-upload
Question    Will the 2 a.m. export be slower over SFTP than over FTPS?
Client      jobhost-01.example.net, scripted client, defaults, no compression
Server      xfer-test.example.net, same host and disk for both protocols
Link        WAN, 100 Mbit/s, RTT 40 ms (ping, 30 samples, median)
Files       1 x 1.5 GB export_YYYYMMDD.csv + 300 x 2 MB detail files, random content
Cache       cold: files regenerated before every run
Stopwatch   wall clock, trigger to final rename (Measure-Command)
Runs        5 per protocol, median and spread, all runs kept in results.csv
Load        real window (02:00), backup job running on the server
If a scheduled task drives the runs, repeating them costs nothing extra. A job defined once in Sysax FTP Automation uses the same connection profile and settings every run. Its email notification tells you the run happened. The next article, designing a transfer benchmark, turns a block like this into a full test plan.
Rule of thumb: before you believe any transfer number, ask three questions. What was the file mix? What was the round-trip time? How many runs? If the answers are "one big file," "we didn't check," and "one," the number is a story, not a measurement.
Reading Numbers From Now On
Benchmarks lie by omission. The page cache turns a disk test into a memory test. A single run turns noise into a fact. One big file hides the per-file cost. The tool's meter times a slice of the job and calls it the whole. None of this needs bad faith, only an unstated condition, and conditions go unstated by default.
The remedy is not heavier statistics. It is a written question, a matched file mix, the real link, a deliberate cache state, five runs, your own stopwatch, and the habit of keeping the raw numbers. Do that, and the next time someone says "a hundred and ten megabytes a second," the honest answer will be a row label. From here, designing a transfer benchmark turns those habits into a test matrix and a run log. And comparing protocols fairly applies them to the question most people actually have. Our protocol performance comparison says what such a test usually shows.
Frequently Asked Questions
Should I benchmark with the cache warm or cold?
My client reports 110 MB/s but the job took much longer. Which number is right?
Does encryption make transfers slow?
Can I predict WAN performance from a LAN test?
From the Sysax team: we build secure file transfer software for Windows. Sysax Multi Server is an FTP, FTPS, SFTP, and HTTPS server. Sysax FTP Automation handles scheduled, scripted transfers. Free trials are on the download page.