
Load Testing a Transfer Server Safely
The sizing worksheet says the server can hold six hundred sessions and the disk will cope with three hundred concurrent uploads. Those are predictions. The only way to know is to open three hundred sessions and watch. The only good time to find out you were wrong is a Tuesday afternoon against a staging server. It is not the last night of the month against production. A load test is that Tuesday afternoon: a controlled, scripted flood of synthetic clients. It ramps up in steps while you watch the counters, and stops the moment a pre-agreed line is crossed.
This article is part of our Capacity & Concurrency series. It shows how to do that without hurting anything. It covers what questions a load test answers, and how to plan one that cannot spill onto partners. It explains how to generate concurrent sessions with a short script, how to ramp and what to watch, and when to stop. It shows how to read the result without believing a single run more than it deserves. It is about testing the server's capacity. Measuring how fast one transfer can go, or comparing protocols fairly, is a different discipline covered in our transfer benchmarking series.
What a Load Test Is For
A load test answers three questions, and you should write your predicted answers down before you start so the test can prove you wrong:
- Where is the ceiling, and which resource sets it? At how many concurrent sessions does the server stop scaling, and is it the disk queue, the CPU, memory, or the network that gives out first?
- Does the server fail cleanly at its limits? When the global limit is reached, do new clients get a fast refusal, or do existing sessions slow and time out?
- What do users experience at the expected peak? Specifically the p95 — the time that 95 percent of logins or uploads finish within — at the session count you expect on the busiest night.
The second question is worth a deliberate step of its own. Set the global limit to a value the generator can exceed, and push past it. Confirm that the extra sessions are refused in under a second while the ones already inside keep their speed. A limit that has never been exercised is a guess. What a load test is not for is squeezing the maximum throughput out of one connection. That figure depends on the client, the cipher, the latency, and the window size. A load generator running hundreds of sessions from one machine is the wrong tool for measuring it. Keep the two goals separate and the results of each stay meaningful.
A Safe Test Plan
Load tests go wrong in two ways: they hurt a system that was not supposed to be involved, or they produce a number nobody can trust. The plan below prevents both. Copy it into the ticket and check the boxes.
- Test staging, not production. A staging server on the same hardware class, with the same server software and limits, answers every capacity question production could, without the risk. Our staging series covers building one. If only production exists, test inside an announced maintenance window, with partners told the server will refuse connections, and with a hard end time.
- Use a dedicated test account with its own upload directory and, if the server supports it, a quota. Every file the test writes lands in one place you can delete afterwards, and the account can be disabled the moment the test ends.
- Run the generator from a separate machine on the same network segment as the server, never on the server itself. The generator's CPU and network card are part of the experiment, and you need to watch them too.
- Make realistic test files from random data, sized like real partner files. A file full of zeros compresses to nothing and lies about disk and network load if compression is on anywhere in the path.
- Snapshot the configuration before changing any limit for the test, so reverting is a copy rather than a memory exercise.
- Agree the stop conditions in advance (below) and who has the authority to call a halt. Under pressure, "one more step" is how tests become outages.
- Have a kill switch. Know the one command that ends every generator session at once, and test it at 25 sessions before you rely on it at 400.
Generating the test file takes one command on either platform:
$ head -c 50M /dev/urandom > /home/tester/payload-50mb.bin

PS C:\> $b = New-Object byte[] (50MB); (New-Object Random).NextBytes($b)
PS C:\> [IO.File]::WriteAllBytes('C:\loadtest\payload-50mb.bin', $b)
Gotcha: never load-test against a partner's server, a shared gateway, or anything on the far side of the internet uplink without explicit agreement. A test that saturates a shared link is an outage for everyone on it, and it is indistinguishable from an attack to the people on the other end.
Generating Concurrent Sessions
The generator is a loop that opens N sessions, ramps them in at a controlled rate, uploads one file each, and records how long each step took. The Python script below uses Paramiko, the standard SFTP library; it runs on any machine with Python installed and needs no server-side agent. Each line is doing something you will want to change later, so it is worth reading through once.
#!/usr/bin/env python3
# loadtest.py N  -- open N concurrent SFTP sessions, upload one file each
import sys, time, threading, paramiko

HOST, PORT, USER = "sftp-staging.example.com", 22, "loadtest"
KEY  = "/home/tester/.ssh/loadtest_ed25519"
SRC  = "/home/tester/payload-50mb.bin"
N    = int(sys.argv[1])
RAMP = 0.2                      # seconds between session starts: 5 per second
results, lock = [], threading.Lock()

def worker(i):
    t0 = time.time()
    try:
        key = paramiko.Ed25519Key.from_private_key_file(KEY)
        tr = paramiko.Transport((HOST, PORT))
        tr.connect(username=USER, pkey=key)
        t_login = time.time() - t0
        sftp = paramiko.SFTPClient.from_transport(tr)
        sftp.put(SRC, f"/upload/lt-{i:04d}.bin")
        sftp.close(); tr.close()
        with lock: results.append(("ok", t_login, time.time() - t0, ""))
    except Exception as e:
        with lock: results.append(("fail", 0, time.time() - t0, str(e)[:60]))

threads = [threading.Thread(target=worker, args=(i,)) for i in range(N)]
for th in threads:
    th.start(); time.sleep(RAMP)
for th in threads:
    th.join()

def p95(xs):
    xs = sorted(xs); return xs[min(len(xs) - 1, int(len(xs) * 0.95))] if xs else 0
ok = [r for r in results if r[0] == "ok"]
print(f"sessions={N} ok={len(ok)} fail={len(results) - len(ok)} "
      f"p95_login={p95([r[1] for r in ok]):.1f}s p95_upload={p95([r[2] for r in ok]):.1f}s")
for r in results:
    if r[0] == "fail": print("  fail:", r[3])
Run it as python3 loadtest.py 100 and it prints one summary line. The RAMP value is the important knob: at 0.2 seconds, sessions start five per second. So 300 sessions take a minute to arrive — a deliberate stampede, but not an instantaneous one. Set it to 1.0 to model spread-out partners or 0.05 to model a clock-synchronized burst. There are two honest caveats. Paramiko encrypts in Python and is slower per session than a native client. So the p95 upload times it reports are pessimistic on the client side. A single generator machine starts to run out of CPU somewhere between two and four hundred sessions. When you need more, run the script from two or three machines at once and add up the results.
If you would rather not write Python, a shell loop around lftp does the same job with less control over timing:
#!/bin/bash
# N concurrent lftp uploads, started five per second
N=${1:-50}
for i in $(seq 1 "$N"); do
  lftp -u loadtest,"$LT_PASS" sftp://sftp-staging.example.com \
    -e "set sftp:auto-confirm yes; put /home/tester/payload-50mb.bin -o /upload/lt-$i.bin; bye" \
    > "/tmp/lt-$i.log" 2>&1 &
  sleep 0.2
done
wait
echo "failed: $(grep -il 'error\|fatal' /tmp/lt-*.log | wc -l)"
For an HTTPS upload portal, the same loop with curl -s -o /dev/null -w "%{http_code} %{time_total}\n" -T payload-50mb.bin --user loadtest:"$LT_PASS" https://.../upload/ in place of lftp records the status code and elapsed time per session. Our Python SFTP basics and lftp articles cover the tools themselves in more depth.
Ramping Up: Step, Hold, Measure
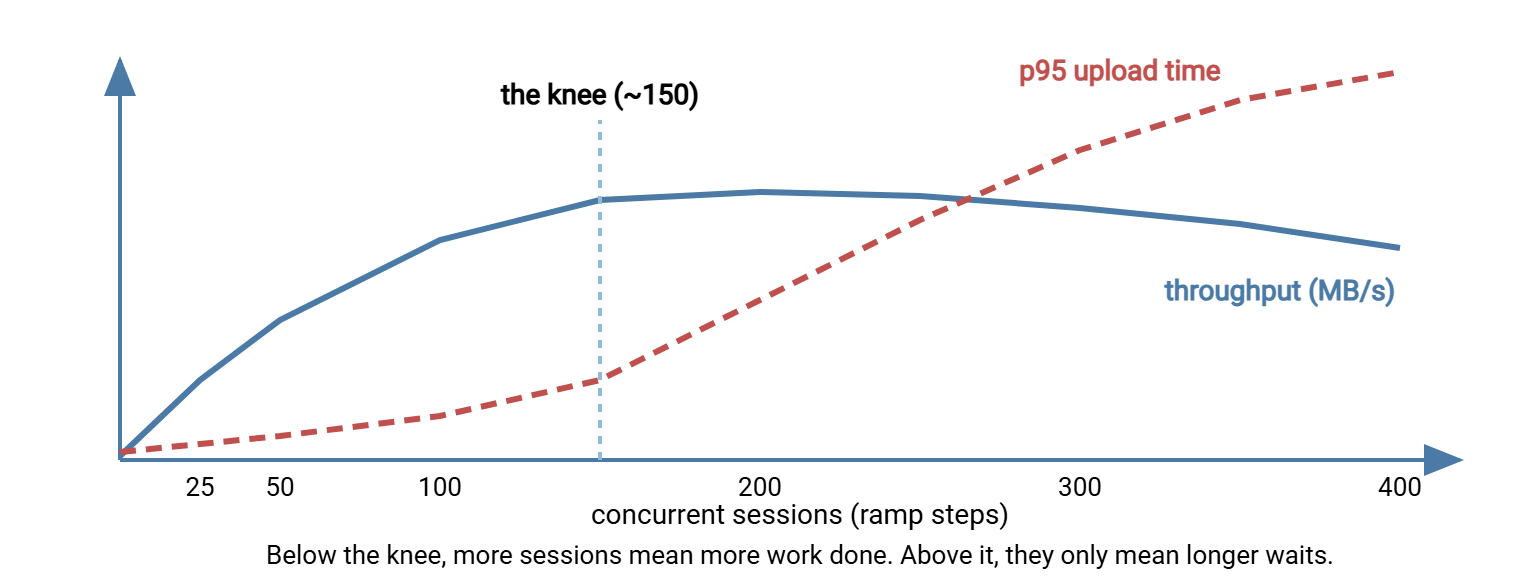
Do not run the target number straight away. Run a series of steps — 25, 50, 100, 200, 300, 400. At each one hold the load for at least five minutes while you record the counters. Then let the sessions drain before the next step. The reason is that a single big run tells you whether the server survived; a ramp tells you where it stopped scaling. That point is the knee. Below it, doubling the sessions roughly doubles the work done and the p95 grows in proportion. Above it, the work done stays flat or falls while the p95 explodes. The knee is the number you came for, and you can only see it by approaching from below.
The hold matters as much as the step. In the first minute of a step the file cache is filling, TCP connections are still ramping their windows, and the disk queue has not settled. Numbers taken then flatter the server. Five minutes lets every counter reach its steady state. Letting sessions drain between steps means each measurement starts from the same quiet baseline instead of inheriting the previous step's backlog. With the script above, one step is simply one run at a given N. The whole ramp is a small wrapper that runs it for each step, pauses two minutes, and appends the summary lines to a file.
The diagram below shows what a ramp looks like when it finds the knee. Throughput rises with sessions until the disk queue takes off, after which more sessions produce longer waits and no more work.
What to Watch on the Server
While each step holds, someone should be looking at the server, not the generator. The counters are the same ones the load basics article introduced. On Linux, two terminals running vmstat 5 and iostat -x 5, plus ss -s once per step, cover it. On Windows, use one continuous Get-Counter:
PS C:\> Get-Counter -Counter @(
  '\Processor(_Total)\% Processor Time',
  '\Memory\Available MBytes',
  '\PhysicalDisk(_Total)\Avg. Disk Queue Length',
  '\PhysicalDisk(_Total)\Avg. Disk sec/Write',
  '\Network Interface(*)\Bytes Total/sec',
  '\TCPv4\Connections Established'
) -SampleInterval 5 -Continuous
Record the values at the end of each hold in a table alongside the generator's summary line. What "healthy" and "stop" look like for each counter:
| Counter | Healthy | Approaching the knee | Stop |
|---|---|---|---|
CPU (us+sy / % Processor Time) |
Under 60% | 70–85%, or one core pinned | Over 90% for two minutes |
Disk queue (aqu-sz / Avg. Disk Queue Length) |
Under 2 per spindle | Climbing step over step | Over 4 per spindle for two minutes |
Write latency (w_await / Avg. Disk sec/Write) |
Under 20 ms spinning, under 5 ms solid-state | Doubling between steps | Over 100 ms |
Memory (free / Available MBytes) |
Falling in proportion to sessions | Under 2 GB | Under 1 GB, or any swap activity (si/so) |
| Network (Bytes Total/sec) | Rising with sessions | Flat at ~115 MB/s per gigabit | Not a stop; it is the ceiling if nothing else moved |
| Generator failures | Zero | Under 1%, all clean refusals | Over 2%, or any timeouts |
Watch the server's own log as well: refusals, "too many open files," and any error you have never seen before belong in the notes with the step number. A server that logs to a database as well as to text files, as Sysax Multi Server can, makes the per-step counts a query rather than a grep. And watch the generator: if its CPU is pinned or its interface is flat, the test has found the generator's ceiling, not the server's. In that case, the rest of the run is meaningless until you add a second machine.
Stop Conditions
A stop condition is a line you drew before the test that ends it automatically when crossed, without a debate. The "stop" column above is the list. The ones that matter most start with timeouts. A refusal is the server working as designed; a timeout is a session that was accepted and then starved. Swap activity also matters: memory has run out and every number after this point is noise. So does write latency above 100 milliseconds: the disk queue is now the whole story. Add to them anything specific to your environment — a production partner reporting slowness, the staging network's shared switch showing errors. When one trips, run the kill switch, let the server drain, and record why. A test that stops at step four with a clear cause is a success. A test that pushed on to step six and crashed the server taught you less, not more.
Remember: you are testing the server, not the generator, and you are looking for the knee, not the crash. Once the p95 starts climbing faster than the session count, you have your answer; everything past that point is just breaking things.
Reading the Results Without Over-Reading Them
Here is what a completed ramp looks like for the example server from this series. It has 8 cores, 16 GB, a mirrored pair of spinning disks, and a gigabit network. This ramp uses 50 MB uploads:
| Sessions | Failed | p95 login | p95 upload | Expected if network-bound | CPU | Disk queue | MB/s |
|---|---|---|---|---|---|---|---|
| 25 | 0 | 0.3 s | 12 s | 11 s | 9% | 1.1 | 109 |
| 50 | 0 | 0.4 s | 24 s | 23 s | 11% | 1.6 | 110 |
| 100 | 0 | 0.6 s | 49 s | 45 s | 14% | 3.8 | 110 |
| 200 | 0 | 1.8 s | 131 s | 91 s | 16% | 19.5 | 104 |
| 300 | 7 | 2.9 s | 260 s | 136 s | 17% | 41.0 | 98 |
| 400 | 62 | 7.4 s | timeouts | 182 s | 18% | 58.3 | 83 |
The "expected" column is what the p95 would be if the gigabit link were the only limit: 50 MB per session at 110 MB/s shared N ways. Up to 100 sessions the measured value tracks it, the disk queue is small, and the CPU is idle — the server is network-bound and healthy. Between 100 and 200 the disk queue jumps from 3.8 to 19.5, the p95 pulls away from the expected line, and throughput starts to fall. That is the knee, somewhere around 150 concurrent uploads, and the resource that set it is the disk. At 300 the first timeouts appear. Step six should never have been run, and in a real test the stop condition at step five would have ended it.
Three conclusions follow, and they are the whole report. The server's practical ceiling on this storage is about 150 concurrent uploads. A global session limit of around 100 (70 percent of the knee) keeps it in the healthy region. The predicted month-end peak of 311 concurrent sessions exceeds that ceiling by a factor of two. So one choice comes from the burst load article: spread the partners. The other comes from the disk row of the sizing worksheet: move the data volume to solid-state storage. And a retest after the storage change is mandatory, because the knee will move and something else — probably the network — will set the new one.
Now the caution. One run is one data point. Caches were cold or warm depending on what ran before. The staging network differs from the internet path partners use. Synthetic files are all the same size. The generator adds its own noise. Run each step three times on different days before trusting a number. Report the range rather than a single value, and never extrapolate above the highest step you actually ran. Our benchmarking series has two articles that apply directly: why transfer benchmarks lie and reporting and regression testing. The latter shows how you turn this test into a quarterly check that catches capacity drift before a partner does.
What to Take Away
A load test turns the sizing worksheet's prediction into a measurement. Plan it so it cannot hurt anything: staging, a test account, a separate generator, random test files, agreed stop conditions, a kill switch. Generate sessions with a short script, and ramp in steps. Hold each step while watching the four resources and the server log, and stop at the first timeout or swap. Read the result for the knee and the resource that caused it, and set the global limit below the knee. Rerun the test whenever the hardware, the server software, or the partner count changes materially.
The counters and limits this test exercises are collected in the capacity tuning checklist. The resource reasoning behind every threshold in the tables above is in how transfer servers handle load.
Frequently Asked Questions
Can I load-test production if I do not have a staging server?
How many sessions should I test up to?
Why do the test's upload times look slower than real partners see?
What is the knee?
Why not use zeros for the test file?
From the Sysax team: we build secure file transfer software for Windows. Sysax Multi Server is an FTP, FTPS, SFTP, and HTTPS server. Sysax FTP Automation handles scheduled, scripted transfers. Free trials are on the download page.