
Reporting Results and Catching Regressions
"Has the server slowed down since the spring?" Somewhere there is a spreadsheet with forty columns that could answer that. It was sent to three people six months ago. None can now say which column was the answer or what the conditions were. I have sent that spreadsheet. Nobody opened it, including me. That is the first thing that goes wrong after a benchmark. The second is that nobody runs it again. The server is patched, a security baseline lands on the job host, and the nightly export quietly takes twice as long. The partner discovers this rather than the team that owns it.
This article fixes both. It gives you a one-page report skeleton a colleague can act on and reproduce, and a baseline that stays comparable across quarters. It lists the changes that must trigger a re-run. It also gives you a workflow that turns the benchmark into a standing regression alarm, with a triage procedure for the day it fires. It is the last article in our Benchmarking Transfer Performance series. It assumes the run log and the five-runs rule from designing a transfer benchmark.
What a Benchmark Report Is For
A benchmark report serves two readers. The first is the person making a decision this week. That might be the manager approving a migration or the partner asking whether their feed will fit its window. That person needs the answer and the confidence to attach to it, and nothing else. The second is a person six months from now, possibly you, who needs to repeat the measurement exactly. Most reports serve neither: they bury the answer under a table and omit the conditions the future reader needs.
The test of a report is whether a competent colleague could reproduce the measurement from it alone. Include the question, the answer, the conditions, the results with their spread, the caveats, and the location of the raw data. Put them on one page, in that order. That way the decision-maker can stop after the second line and the future reader can keep going.
The One-Page Report Skeleton
The skeleton below is the whole report. It is plain text on purpose. It pastes into a ticket, an email, or a readme beside the raw data, and it survives every tool change.
BENCHMARK REPORT  nightly-export-upload                     id: bench-export-03
Question   Will the 2 a.m. export fit its 20-minute window over SFTP instead of FTPS?
Answer     Yes. SFTP median 3 min 02 s vs FTPS 2 min 56 s over the WAN; the
           difference is inside the spread, and both fit easily.

Setup      client   jobhost-01.example.net, scripted client, defaults, no compression
           server   xfer-test.example.net, same host and disk for both protocols
           link     WAN 100 Mbit/s, RTT 40 ms (median of 30 pings before each run)
           files    mixB_YYYYMMDD: 1 x 1.5 GB + 300 x 2 MB, random bytes, checksums kept
           cache    cold (files regenerated before each run)
           clock    wall clock, scheduler trigger to final rename (Measure-Command)
           runs     5 per cell, real window (02:00), backup job active on the server

Results    cell                    median       spread           n
           FTPS mixB up WAN        2 min 56 s   2:51 to 3:08     5
           SFTP mixB up WAN        3 min 02 s   2:58 to 3:10     5

Reading    A tie for this mix; choose on security and partner grounds.
Caveats    Not tested: download direction, parallel connections, the 5,000-file feed.
Raw data   \\fileserver\bench\export-03\  (runlog.csv, harness, test-set generator)
Re-run     after server updates, cipher policy changes, WAN provider changes
Baseline   yes: supersedes bench-export-02        owner: transfer team
Each part earns its place. The question comes first because a result without its question is a number without a meaning. The answer is one or two plain sentences with the confidence stated ("inside the spread" is a confidence statement). It is placed above the setup so a reader in a hurry gets it in ten seconds. The setup block is the conditions from the run log, the part future readers depend on. The results table carries a median, a spread, and the run count for every cell, never a lone number. The reading says what the results mean for the decision. The caveats say what was not measured, so nobody extrapolates the export result to the small-file feed. (Somebody will try. The caveat is for them.) Raw data points at the folder with the run log and scripts. The re-run line names the changes that trigger the next measurement. The last line says whether this report becomes the baseline.
Remember: answer first, conditions second, numbers with their spread, caveats always, raw data location every time. A report a colleague cannot reproduce is an opinion with a table attached.
Presenting Numbers Honestly
A few presentation habits keep numbers honest once they leave the run log.
- Median and spread, in words. "Three minutes, spread 2:51 to 3:08, five runs" gives the typical result and how much it moved. An average hides a stalled run; a lone best run is a story.
- Ties are results. "No meaningful difference" hands the decision to grounds that matter more. Say it plainly rather than manufacturing a winner from a three-percent gap inside the spread.
- No percentages from single runs. "Twelve percent faster" from one run each is noise dressed as precision. Quote percentages only between medians whose spreads do not overlap.
- Charts, if any, show the spread. Use a bar per cell with a line from fastest to slowest run. A bar without the spread invites the reader to see differences that are not there.
- Keep every run. The raw runs live beside the report. A run excluded from the summary is named in the caveats with its reason ("run 3 coincided with a full antivirus scan"), never silently dropped.
Two earlier articles back this list. See why most transfer benchmarks lie for the distortions a report must not reintroduce. And measuring what users feel covers the second kind of number (seconds to connect, seconds to list, minutes to arrive). That belongs beside throughput when people are the audience.
Keeping a Baseline
A baseline is a benchmark result you have decided to treat as the reference. It is the known-good measurement of a specific job, under recorded conditions, that every later run is compared against. It is not the fastest result you ever saw. It is the honest median and spread of the job as it normally runs, taken when the system was known to be healthy.
A baseline stays comparable only if five things are kept together. Keep the frozen test set with its checksum list, so a run next year uses the same files. Regenerated random content is fine; a different shape is a different benchmark. Keep the harness scripts that reset, regenerate, time, and log, under version control or at least as dated copies. That way the procedure cannot drift. Keep the conditions block from the report. Keep the run log with every run. And keep the numbers: median and spread per cell.
Keep a short register of active baselines, so anyone can see the reference and when it was set:
BASELINE REGISTER   xfer-test.example.net
id            job              cell                       median / spread        set     supersedes    reason
bl-export-3   nightly export   SFTP mixB up WAN           3:02 / 2:58 to 3:10    wk 14   bl-export-2   new WAN provider
bl-feed-1     partner feed     SFTP mixC up WAN, 4 conn   4:05 / 3:50 to 4:30    wk 09   -             first baseline
bl-lan-ctl    LAN control      SFTP mixA up LAN           21 s / 20 to 22 s      wk 09   -             first baseline
bl-felt-1     office probe     connect / list / 20 MB up  0.4 s / 0.5 s / 6 s    wk 12   -             after DNS fix
Two rows deserve explanation. The LAN control isolates the server and its disk from the network: one large file on the LAN, where round-trip time is negligible. When a WAN cell regresses and the LAN control does not, the problem is the network path or the window. When both regress, it is the server, the disk, or the client. Keep one even if no real job runs on the LAN. The felt-time probe row carries the user-facing numbers, because a throughput-only baseline never catches the regression users notice first.
A baseline is superseded, not edited. When the hardware, network, platform, or job legitimately changes the numbers, take a new baseline under the new conditions. Record why in the register, and keep the old one for history. Two moments almost always call for one. The first comes in the first weeks after a new server goes into service. That is part of the rollout in the choosing a transfer server series. The second is the cutover to a new platform, where the old baseline describes hardware that no longer exists. See the platform migration mechanics series for what else changes that night.
Re-Running After Every Meaningful Change
A regression is rarely a mystery once you know when it started. The only way to know is to have measured before and after each change. The table lists the changes that should trigger a re-run, which cells, and why. Every row follows the same rule: same harness, same frozen files, same time window, five runs, compared against the baseline's median and spread.
| Change | Re-run | Why |
|---|---|---|
| Transfer server software update | Every baseline cell | The server is the thing under test |
| Operating system patches on server or client | LAN control plus each job's cells | Network stack and crypto libraries change underneath everything |
| Security baseline, hardening, cipher, or scanning policy change | Every cell, WAN first | These change TCP, DNS, cipher, scanning, and logging settings |
| Network change: firewall, WAN provider, VPN, routing | WAN cells and the felt-time probe | Round-trip time and path behavior change |
| Storage change or moved landing folder | LAN control plus the batch mix | The disk is often the real limit |
| Client build or connection profile change | That job's cells | The client is half of every measurement |
| New platform, new hardware, or move to a VM or cloud host | Everything, then take a new baseline | Different hardware is a different reference |
| Nothing changed for a month | LAN control plus one WAN cell | Drift you did not cause still counts |
The third and last rows are the ones teams forget. Hardening baselines arrive from other teams on their own schedules and touch exactly the settings transfer performance depends on. The patch process in our guide to update and patch strategy is the natural place to attach a re-run. The article regression testing transfer jobs fits the same runs into a staging process. And "nothing changed" is never quite true. A switch firmware update, a provider reroute, a folder that has grown: something changed. It just was not you. A monthly re-run earns its half hour even in a quiet quarter.
The Regression Alarm Workflow
Re-running after known changes catches the regressions you can see coming. The regression alarm catches the rest. A small fixed set of cells runs on a schedule, appended to a log, compared with the baseline. An alert fires when the comparison fails. The diagram below shows three months of the alarm's data for one job.
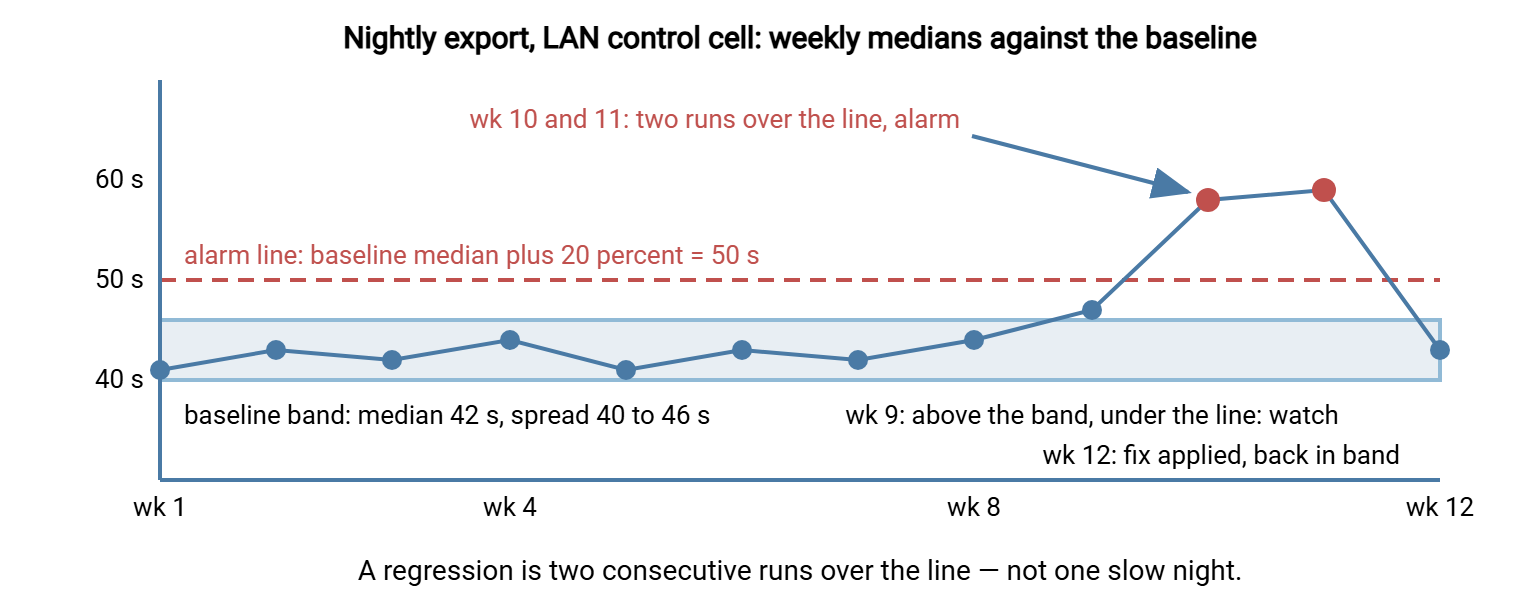
The workflow behind that picture has six small steps.
- Schedule a fixed set of cells. The LAN control, one WAN cell per important job, and the felt-time probe. Weekly suits most servers; nightly when jobs have tight windows. The set never changes between baselines: a changing set is not a trend.
- Append, do not overwrite. Every run adds lines to the log the baseline came from, with the same fields. The trend is the log.
- Compare against the baseline with a written rule. A sensible rule sets the line at twenty percent above the baseline median or outside the baseline spread, whichever is larger. A run is over the line when its median exceeds that threshold. It is a watch when above the spread but under the line. The threshold must exceed the baseline's own spread, or the alarm fires on noise.
- Require two consecutive runs over the line before alerting. One slow night is a backup that overran or a link that flapped; two in a row is a change. Week nine in the diagram is a watch; weeks ten and eleven are the alarm.
- Alert somewhere a person will read it. Send an email or ticket with the cell, the baseline, the two medians, and the condition fields for the two runs. That is enough to begin triage. Our article on alerting that gets read covers the difference between an alert and noise.
- Triage, then fix or re-baseline. The procedure in the next section. The alarm closes with the number back inside the band. Or it closes with a new baseline whose register entry says why the new normal is acceptable.
The scheduled runs need no one awake. A benchmark job defined in Sysax FTP Automation runs the same transfer set on the same schedule with the same profile. Its email notification confirms the run happened. If the server is Sysax Multi Server, its activity log supplies the server-side clock for the same runs. That log is a file or a database with a timestamp for every login and transfer. Where the results should live is in our guide to transfer dashboards and reporting, built around this kind of plain-words number.
One more rule: silence is not good news. A benchmark job that stops running (lost credentials, a rebuilt probe host, a moved log share) produces no alarm and no data. So a missing run must be treated as an alert in its own right. A dead alarm looks exactly like a healthy server. Our article on monitoring the monitoring explains how to check that the checker is alive. For the regression alarm, a weekly line saying "run happened, result within band" is the heartbeat.
Rule of thumb: use a fixed set of cells, appended to one log, compared against a baseline by a written rule. Alert on two consecutive runs over the line. A missing run counts as a failed one.
Triage When the Alarm Fires
When the alarm fires, the temptation is to start turning knobs. Resist it. A regression has a cause, the cause is almost always a change, and a short ordered procedure finds it faster than tuning.
- Is it real? Look at all five runs of each alarming night, not just the medians; a wide spread means something intermittent. Repeat the cell once by hand.
- Were the conditions the same? Read the condition fields for the alarming runs: round-trip time, server load, other jobs, clock time. A doubled RTT is a network change, not a server regression. A backup that now overlaps the window is a scheduling problem. A link another job has started filling is a bandwidth problem (see measuring bandwidth impact).
- What changed? List every change to the server, the client host, the network, and the policies since the last good run. Include updates, patches, baselines, folder moves, scanning rules, client builds. Check the test set's checksums too.
- Isolate. Run the LAN control. If it regressed too, the problem is the server, the disk, or the client. If not, it is the network path or the window. Run the job from a second client to separate client from server. Run a plain local copy on the server's disk to separate the disk from everything else. When all three pass, finding the bottleneck takes this step further.
- Fix or accept. Revert the change if you can, and re-run to confirm the number is back in the band. If the slowdown is legitimate (a scanning policy the organization has decided to keep), take a new baseline. In that case, record the reason and update any targets built on the old number.
Northgate Retail's alarm fired on the nightly export's WAN cell. The median had gone from about three minutes to about twenty-two, two weeks running. The job was missing its twenty-minute window. The runs were tight, so it was real. Round-trip time was unchanged at 40 milliseconds, so it was not the network. The LAN control was unchanged, so it was not the server or the disk. The change list held one entry: a security baseline applied to the job host the week before. It had disabled receive window autotuning, leaving every connection a small fixed window. On a 40 millisecond link, that window caps a single connection at roughly one and a half megabytes per second however fast the link is. Re-enabling receive window autotuning, with the security team's agreement and a note in the baseline's exceptions, brought the next run back to three minutes. The arithmetic behind the cap is the bandwidth-delay product. The checks to run before blaming anything else are in TCP tuning first. The alarm turned a partner complaint two months later into a one-week fix.
Note what the triage did not involve: no cipher changed, no buffer tuned, no parallelism added. The number was restored by finding the change, not by compensating for it. When triage does end in tuning, it is because the change must stay and the job must still fit its window. In that case, use the one-change-at-a-time method in the tuning knobs worth benchmarking. Record the result as a new baseline.
From Exercise to Instrument
A benchmark run once is an exercise; it answers one question and decays. Report it on one page and keep it as a baseline with its frozen files and scripts. Re-run it after every meaningful change, and schedule it as an alarm. That makes it an instrument. It says the server has slowed down before the partner does, while the change is still fresh enough to find. The apparatus is a text template, a register, a table of triggers, a scheduled job, a comparison rule, and a five-step triage. None of it is sophisticated, and all of it is rare. It also answers "has the server slowed down since the spring?" in one line, which the spreadsheet never did.
This closes the series. If you arrived here first, the foundations are in why most transfer benchmarks lie and designing a transfer benchmark. The user-facing half of the instrument is in measuring what users feel. For the fields a transfer server should log so the server-side clock is there when you need it, see our guide to what to log.
Frequently Asked Questions
How long should a benchmark report be?
What is a performance baseline?
How often should I re-run the benchmark?
What counts as a regression rather than a slow night?
Should I tune the server when the alarm fires?
From the Sysax team: we build secure file transfer software for Windows. Sysax Multi Server is an FTP, FTPS, SFTP, and HTTPS server. Sysax FTP Automation handles scheduled, scripted transfers. Free trials are on the download page.