
Diagnosing Intermittent Drops
A transfer that fails every time is a gift: you can watch it fail, change one thing, and watch again. A transfer that fails one night in five is a different animal. Nobody is watching when it happens, and the retry usually succeeds. By the time anyone looks, the only evidence is a line in a log and a vague sense that "it's the network." Intermittent drops are where dropped-session problems go to live for months.
They are not random. Something varies between the runs that succeed and the runs that fail. It might be duration, time of day, the path the traffic took, or whether the server was busy scanning another upload. The whole diagnostic job is to find that variable. This article is the method. Gather logs from all three vantage points onto one clock. Tabulate the failures until a pattern appears. Read the "exactly N minutes" tell and confirm with a packet capture. Then build a reproduction that turns "sometimes" into "every time" so the fix can be tested. It is the last article in our Timeouts, Keepalives, and Dropped Sessions series and draws on the vocabulary from anatomy of a dropped session.
Step One: Three Logs, One Clock
A dropped session has at least three witnesses: the client, the server, and whatever stateful device sat between them. Each saw a different part of the event. The client knows when it stopped getting replies. The server knows when it last heard from the client and why it closed the session. The firewall or NAT device knows, if it logged anything, when it decided the connection was over. The story is in the alignment of all three.
Alignment needs a shared clock. Confirm that every machine synchronizes its time from the same source. Find out what time zone each log is written in. Servers frequently log in UTC while clients log in local time. A three-hour offset has sent many people chasing a timer that did not exist. Then pull the three logs for one failed run and lay them side by side. The diagram shows the classic case, an FTP upload whose control connection was forgotten by a firewall an hour in.
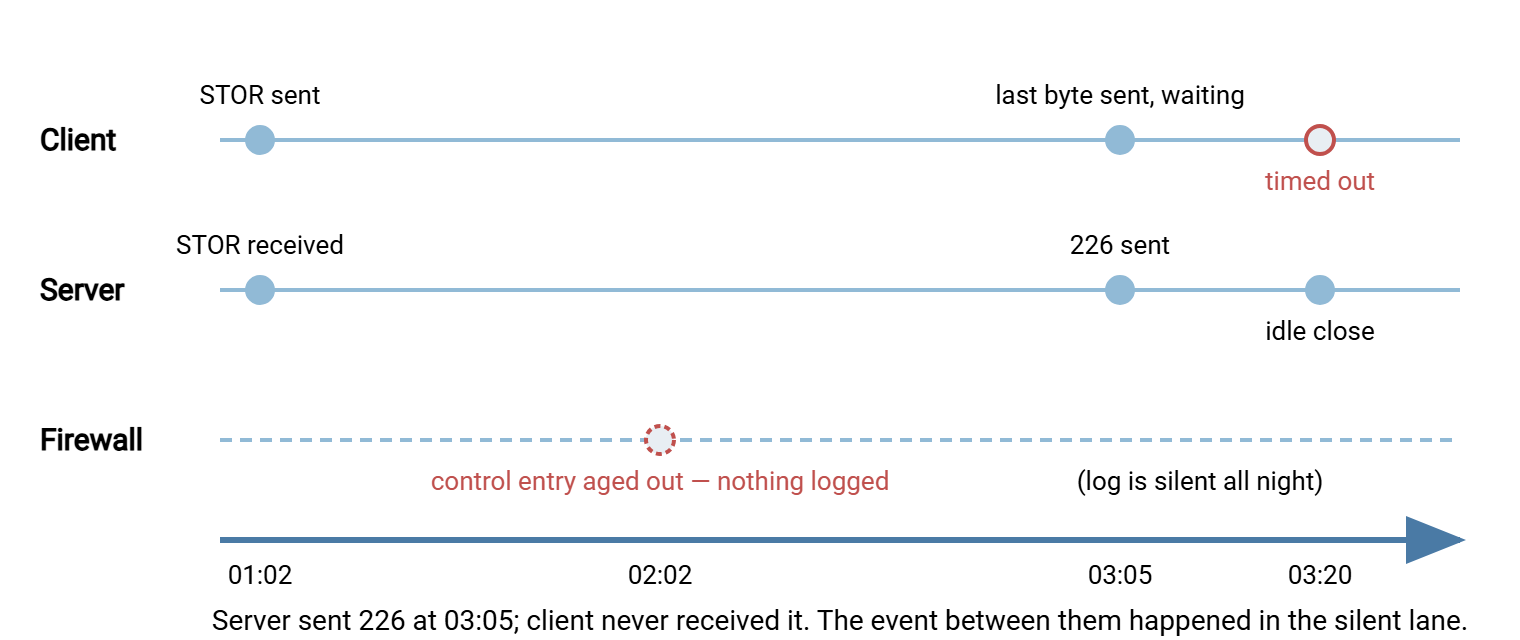
In text, the same correlation is a small table, and building it by hand for two or three failures is the most productive hour you will spend:
time (UTC)   client (branch07)                 server (ftp01)                     firewall (branch)
01:02:11     230 login, STOR, 150 ok           user in, STOR /inbound/set-a.tar    session allowed 21/tcp
01:02:12     data connection opened            data connection accepted           session allowed 50007/tcp
02:02:1x     -                                 -                                  (control entry idle 60 min: expired, unlogged)
03:05:40     last byte sent; waiting for 226   226 sent; session now idle         -
03:20:41     -                                 idle timeout; FIN sent             -
03:20:51     "Connection timed out"            -                                  -
Reading it: the server sent 226 and the client never saw it, so the packet died between them. The server's own close came later, on its own idle timer, which rules the server out as the killer. The client waited its retransmission period and reported the silence ending. The only lane that can explain a packet vanishing between two healthy endpoints is the middle one. Its silence is consistent with an aged-out state entry. If the server writes each session's start, transfers, and end to a log, the server column is a query rather than an archaeology project. Sysax Multi Server logs to a file or a database. See reading transfer logs for the habits, and centralizing logs for pulling all three into one place.
Step Two: The Failure Table
One correlated failure suggests a cause. A table of every failure and, just as important, every success over a few weeks reveals the variable. One row per run:
date   start  end/fail  elapsed  size    from       path        result   error text
Mon    01:00  02:41     1h41     58 GB   branch07   VPN-A       ok
Tue    01:00  03:20     2h20     61 GB   branch07   VPN-A       FAIL     Connection timed out
Wed    01:00  02:35     1h35     55 GB   branch07   VPN-A       ok
Thu    01:00  02:58     1h58     60 GB   branch07   VPN-B       ok
Fri    01:00  03:22     2h22     62 GB   branch07   VPN-A       FAIL     Connection timed out
Sat    01:00  02:07     2h07     61 GB   branch07   VPN-B       ok
Six rows are enough to see it. Every failure ran longer than two hours; every success ran shorter — except Saturday, which ran longer over path B and succeeded. Two variables are now suspects: elapsed time and path. The duration threshold says "timer"; the path dependency says "a timer on path A that path B does not have." Nobody had mentioned that the branch sometimes fails over to a second VPN concentrator, and nobody had recorded which one carried the traffic. That is intermittent problems in general: the variable that matters is one nobody was logging. When the first columns do not separate the runs, add the ones people forget. These include which firewall cluster member was active and whether a backup or scan was running on the server. Also include how busy the link was, and the exact client host.
| Pattern in the table | What it usually means |
|---|---|
| Failures all exceed one elapsed time; successes all fall under it | An idle timer on the silent connection, set to about that time — see address table expiry |
| Failures cluster at one wall-clock time regardless of when the job started | A scheduled event: firewall policy reload or failover, ISP reconnection that changes the public address, server backup or restart, log rotation restarting a service |
| Failures on one weekday | Patching windows, weekly full backups saturating the link, a weekly report job holding the server busy |
| Failures only from one site or one path | A device unique to that path with a shorter timer or a different helper configuration |
| Failures only when the server is handling other large uploads | The server's post-transfer processing is slow under load and the client's response timeout fires — a client timer, not the network |
| No pattern in duration, time, or path; error is always "reset" | Something actively resetting sessions: an intrusion-prevention rule, a connection limit being hit, a flapping link or failover pair |
The "Exactly N Minutes" Tell
The most valuable pattern is a failure at a fixed elapsed time, and it is worth being exact about what to measure. A timer counts from the last packet on the connection that died. It is reported only when someone tries to use the connection and gives up. So a control connection forgotten at sixty minutes shows up on the client as a failure at "transfer end plus fifteen minutes". On a two-hour upload, that is two hours fifteen, not sixty. Convert every failure time to "minutes since the last packet on the dead connection" before looking for the round number. For an FTP control connection, that last packet is at the transfer's start. For an SFTP session idle between files, it is at the end of the previous file. For an HTTPS upload waiting on server processing, it is the last byte sent.
Once converted, the round numbers point at owners. Five minutes says consumer NAT, load balancer, or a client response timeout. Fifteen says a server idle limit or VPN idle timer. Thirty and sixty say firewall TCP timers. Two hours says the operating system's default TCP keepalive finally probing. The fuller table of owners is in address table expiry.
A fixed wall-clock time is the other tell, and it points somewhere else entirely. Sessions that all die at three in the morning regardless of when they started are not hitting an idle timer; something happened at three. Firewalls reload policy and drop state on a schedule. High-availability pairs fail over for maintenance. Some internet connections are reconnected once a day by the provider and come back with a different public address. That invalidates every NAT mapping at once. And servers reboot for patches. The failure table separates the two tells. A fixed elapsed time with varying end times is an idle timer. A fixed end time with varying elapsed times is a scheduled event.
Remember: convert every failure to "minutes since the last packet on the connection that died" before looking for the round number. Subtract the retransmission delay. A two-hour-fifteen failure on a two-hour upload is a one-hour timer, reported late.
Packet Captures in Words
Logs tell you what each program believed. A packet capture tells you what actually crossed the wire. For a dropped session, it answers three questions logs cannot. Did the last packet leave the sender? Did it arrive at the receiver? Who sent the packet that ended the session? You do not need to be a protocol analyst to get those answers.
Capture at both ends at once if you can, filtered to the server's address, so the files stay small. On Linux:
# on the client: everything to and from the server, control and data, into a rotating set of files
tcpdump -i eth0 -w /var/tmp/drop-client.pcap -C 100 -W 10 host 203.0.113.10

# on the server: the same, seen from its side
tcpdump -i eth0 -w /var/tmp/drop-server.pcap -C 100 -W 10 host 198.51.100.24

# after a failure: list only the session's control connection, packets and flags
tcpdump -nn -r /var/tmp/drop-client.pcap 'port 21' | tail -40
On Windows, the built-in pktmon tool or a graphical analyzer does the same job. The -C and -W options keep a ring of files so a capture can run for days without filling the disk. That is exactly what an intermittent problem requires. Start it, wait for the next failure, then look at the minutes around the failure time.
Then read the end of the connection:
- A FIN from the far side — the far program closed on purpose; its log will say why. If the FIN appears in the server's capture but never in the client's, the path dropped it, which is itself the finding.
- An RST from the far side — compare it with normal packets from the same address. Every router a packet crosses lowers its time-to-live counter by one, so packets from the same real source arrive with the same TTL. An RST whose TTL differs from the server's other packets was not sent by the server: a middlebox forged it. This one check settles most "the server reset me" arguments.
- The same data packet sent again and again with no acknowledgment — the silence ending. If the server's capture never shows those packets arriving, the path is discarding them. If they arrive and the server never answers, look at the server.
- Keepalive probes, or their absence — tiny packets at a regular interval on the idle connection. If they are missing when you believed keepalives were on, the program never enabled them. This is the most common reason a keepalive "did not work". See keepalives per protocol.
- A packet that leaves one capture and never appears in the other — the most direct evidence there is that a device between the two ends dropped it. The timestamp of the first such packet is the moment the entry expired.
The Reproduction Test
An intermittent problem becomes solvable the moment you can make it happen on demand. The failure table tells you which variable to push; the reproduction pushes it deliberately and holds everything else still.
For a suspected idle timer, the test is idleness itself. Open a session through the suspect path, leave it silent for a chosen number of minutes, then send one command and see whether it answers. Bisect: if forty minutes survives and eighty does not, try sixty; three or four rounds pin the timer to within a few minutes. A minimal FTP version needs nothing but a shell:
#!/bin/bash
# idle-test.sh: open an FTP control connection, stay silent, then ask for a reply
IDLE=${1:-2400}                       # seconds of silence to test (forty minutes here)
exec 3<>/dev/tcp/ftp.example.com/21
read -t 10 banner <&3; echo "banner: $banner"
printf 'USER svc_test\r\n' >&3; read -t 10 r <&3; echo "$r"
printf 'PASS %s\r\n' "$FTP_PASS" >&3; read -t 10 r <&3; echo "$r"
echo "idling for $IDLE seconds from $(date -u +%T)"
sleep "$IDLE"
printf 'NOOP\r\n' >&3
if read -t 30 r <&3; then echo "alive after $IDLE s: $r"; else echo "DEAD after $IDLE s"; fi
Run it from the branch, not from the office — the timer is a property of the path. Run it once more with the client's TCP keepalive enabled. Use this run to confirm that the fix, and only the fix, changes the result. For SFTP the same test is an sftp session with a sleep in a batch file. For HTTPS it is an idle connection held open by a small script.
For a suspected scheduled event, hold several sessions open across the suspect time. If they all die together at three o'clock, the wall-clock tell is confirmed. The question then becomes what runs at three. For a suspected load-dependent server delay, upload two large files at once and measure how long the final reply takes. If it exceeds the client's response timeout, the client timer is the culprit and the server's processing is the cause.
Decision Table: Symptom to Likely Culprit
The table condenses the method. Find the row whose symptoms match, check the evidence column against your logs and capture, and start with the culprit named. The broader sequence for failures that are not drops at all is in our systematic troubleshooting series.
| Symptom | Confirming evidence | Likely culprit |
|---|---|---|
| Long transfers fail, short ones succeed; file complete on server; "timed out" | Server log shows 226 sent and a later idle close; firewall log empty; retransmissions in capture | Firewall or NAT idle timer on the control connection |
| "Reset by peer" at a fixed elapsed time; both ends see it at the same second | RST in both captures; TTL of the RST differs from the far end's other packets | Middlebox configured to reset on expiry |
| "Reset by peer" on the client; nothing at all in the server's application log | Server capture shows the client's packet arriving from a new source port and an RST going back | NAT mapping expired; client reappeared on a new port |
| Client "timed out" within a minute; server "client disconnected" at the same moment | Server was busy (scan, hash, other uploads); capture shows the client sending FIN first | Client response timeout shorter than the server's slow reply |
| "Closed by remote host" or "421 Timeout" between transfers | Server log states idle timeout; FIN from the server in the capture | Server idle limit versus a script's long pause |
| All sessions die at the same wall-clock time | Failure table shows fixed end time, varying elapsed; public address or firewall state changed then | Scheduled reload, failover, reconnection, or restart |
| Fails from one site only, same job succeeds elsewhere | Idle test from that site dies at a fixed interval; from elsewhere it survives | A device unique to that path — see the firewalls and NAT series |
| Keepalives "enabled" but nothing changed | No probe packets in the capture during idle periods | The program never enabled keepalive on its socket, or the interval exceeds the timer |
Writing Up the Fix
An intermittent drop that took three weeks to diagnose deserves ten minutes of writing. The next one will look the same, and the person facing it may not be you. Record five things. Start with the symptom as users described it. Add the evidence that identified the cause: the correlation table, the failure-table pattern, the capture observation. State the cause in one sentence. Record the change made and where. Include the verification: the reproduction test that failed before and succeeds now, run from the real path. Add the numbers: the timer value found, the keepalive interval chosen, the response timeout set. They belong in the flow's runbook, as described in our documenting transfer flows series. The habit of turning an incident into a short, honest record is the subject of running your own postmortem.
If the fix needs another team — a firewall timer raised, a load balancer's idle timeout extended — the write-up is also the change request. Give them the connection's four numbers (both addresses, both ports), the timestamps, the capture observation that names their device, and the exact change you want. "The firewall is dropping our transfers" starts an argument. "The state entry for this connection expires at sixty minutes idle. Here are the packets. Please raise it to three hours for these ports." That starts a change window.
Gotcha: the retry that "fixed it" is the reason the problem is still there. Every automatic retry that succeeds hides one more data point from the failure table. While you are diagnosing, log every attempt — including the ones that later succeed on retry. Otherwise, you will be looking at a table with half its rows missing.
Wrapping Up
Intermittent drops are ordinary drops with a hidden variable. The method finds it. Put the three logs on one clock and correlate a single failure. Tabulate every run, successes included, until duration, time, or path separates the failures from the rest. Convert elapsed times to "minutes since the last packet on the dead connection" and read the round number. Confirm with a capture at both ends. Look for a forged RST's TTL or a packet that leaves one capture and never reaches the other. Check for the absence of the keepalives you thought were on. Then reproduce it on demand so the fix can be proven rather than hoped for.
Once the culprit is named, the fix is in the earlier articles. Use tuning both ends for long transfers for the settings. Use keepalives per protocol for the packets that keep the timers from firing again. Whatever you find, write it down — the job that fails one night in five is the job whose history nobody remembers.
Frequently Asked Questions
The firewall log shows nothing. Does that rule the firewall out?
How do I tell whether a reset came from the server or from a device in between?
Why do I need the successful runs in the failure table?
How long should I run a packet capture for an intermittent problem?
What if the reproduction test never fails?
From the Sysax team: we build secure file transfer software for Windows — Sysax Multi Server, an FTP, FTPS, SFTP, and HTTPS server, and Sysax FTP Automation for scheduled, scripted transfers. Free trials are on the download page.