
Service Liveness: Synthetic Logins and Protocol Checks
The most confident-looking monitoring dashboards are often the most misleading. A port check turns green, a ping succeeds, and everyone relaxes — while real users cannot log in. The gap between "the port answers" and "a person can actually transfer a file" is where the worst outages hide. They look like health from a distance. This article closes that gap with the single most valuable health check a transfer server can have: a synthetic login. It logs in and moves a file exactly the way a real client would.
You will learn the difference between liveness and readiness, and how to build a probe for each protocol you run. You will learn how to set up a safe canary account and canary file so the probe touches nothing important. We will cover how often to run the checks, and how to make the probe measure response time as well as success. You will also learn how to alert on failure without drowning yourself in noise. Every command here is shaped to run unattended, on a schedule, without a human watching. This is part of our server health monitoring series and builds directly on the health pyramid from what healthy means for a transfer server.
Liveness, Readiness, and Synthetic Transactions
Three terms, defined once so the rest of the article is precise.
Liveness is the question "is the service alive?" — is the process running and responding at all. A crashed service fails its liveness check. Readiness is the question "is the service ready to do useful work?" A service can be alive (process up, port open) but not ready (rejecting logins because a disk is full or a dependency is down). The distinction matters because the fixes differ. A dead service needs a restart. An alive-but-not-ready service needs you to find what it is waiting on.
A synthetic transaction is a fake but complete piece of work, performed on a schedule purely to test the path. It is not driven by a real user, but is indistinguishable from one as far as the server is concerned. For a transfer server, the synthetic transaction is a login followed by a small file operation. Because it exercises the whole stack the way a real client does, it tests readiness, not just liveness. That is why a synthetic login is worth more than any number of port checks: it is the only probe that fails when logins fail.
Remember: a port check proves the door opens. A synthetic login proves someone can walk through it, do their business, and leave. Only the second one fails when authentication, permissions, or disk break — which is exactly when you most need to know.
The Probe Ladder: How Deep Does a Check Go?
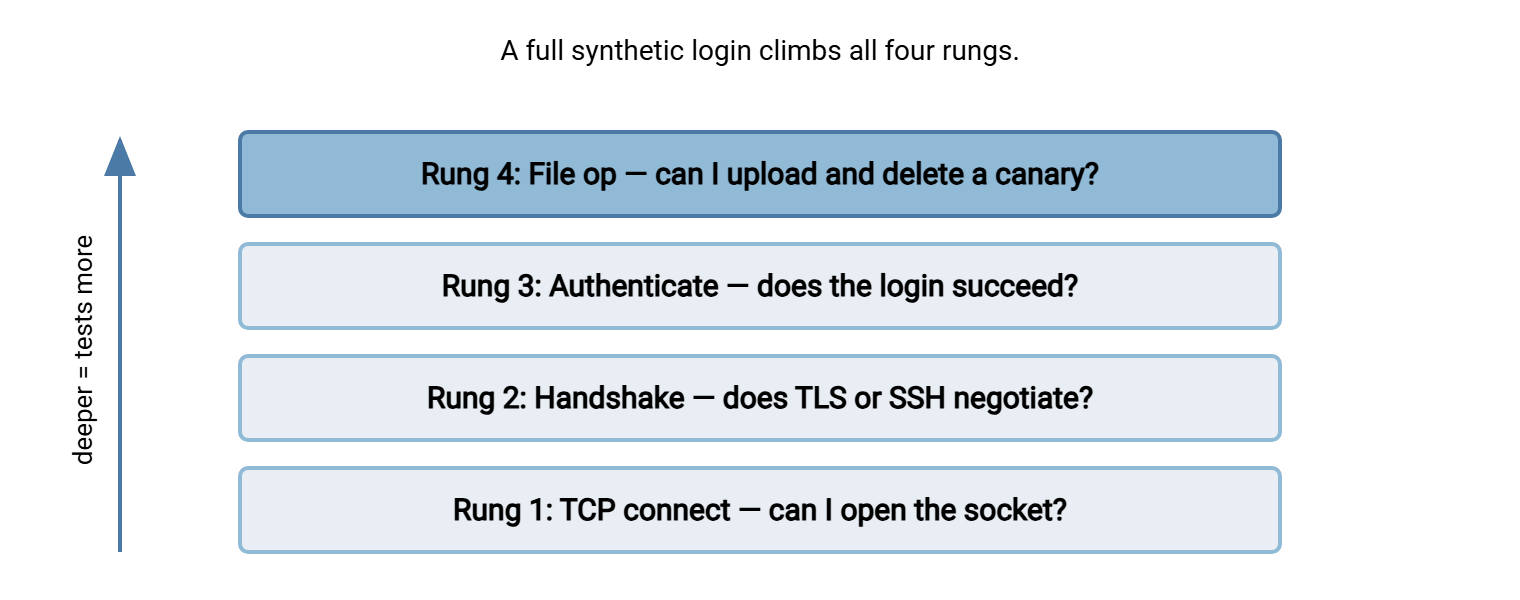
Probes come in depths, and deeper probes catch more but cost more to build and run. Picture a ladder: each rung tests everything below it plus one more thing. The lowest rung is a TCP connection — can you open a socket to the port. Above that, the protocol handshake — does the TLS or SSH negotiation complete. Above that, authentication — does a login succeed. At the top, a real file operation — can you upload and delete a small file. A failure at any rung tells you exactly how far the path got before it broke.
The diagram below shows the ladder. In practice you run a cheap low rung frequently and a full-depth synthetic login a little less often. That way, you always know both "is it reachable" and "does it actually work."
The Canary Account and the Canary File
A synthetic login needs an account to log in as, and that account is a small security decision worth making deliberately. Call it a canary account — a dedicated, low-privilege account that exists only for health probes. Name it so its purpose is obvious (something like healthcheck). Give it its own credentials, never reused elsewhere, and confine it to a single directory that contains nothing real.
Inside that directory lives the canary file — a tiny test file the probe uploads, verifies, and deletes on every run. Because the probe both writes and removes it, the canary account needs write and delete rights in exactly one folder and no rights anywhere else. This containment is the whole point. A probe that runs every few minutes for years should never be able to touch production data, even if its credentials leak. The principles behind scoping an account this tightly are covered in least privilege in practice. The account-hygiene angle is covered in service account hygiene.
One caution: the canary account is still an account, and it will show up in your authentication logs and your brute-force defenses. Document it so that its constant, regular logins are not mistaken for an attack. That also helps its failures be recognized as a probe result rather than a user complaint. The interaction between health probes and intrusion defenses is worth noting in your auth-attack monitoring.
A Synthetic SFTP Login, Step by Step
Here is a complete synthetic login for SFTP using the OpenSSH command-line client, which is present on virtually every modern system. The probe uploads a canary file, lists it back to confirm it landed, deletes it, and reports success or failure through its exit code. It runs from a batch file so no interactive input is needed.
#!/bin/sh
# synthetic SFTP login probe -- exits 0 on success, non-zero on failure
HOST="transfer.example.com"
USER="healthcheck"
KEY="/opt/healthcheck/id_probe"
CANARY="/opt/healthcheck/canary.txt"

echo "probe $(date '+%b %d %H:%M')" > "$CANARY"

sftp -b - -i "$KEY" -oBatchMode=yes -oConnectTimeout=15 "$USER@$HOST" <<'SFTP'
cd health
put /opt/healthcheck/canary.txt
ls -l canary.txt
rm canary.txt
SFTP

RC=$?
if [ "$RC" -eq 0 ]; then
  echo "OK: synthetic SFTP login succeeded"
else
  echo "FAIL: synthetic SFTP login returned $RC"
fi
exit "$RC"
The important design choices: -oBatchMode=yes means the client never pauses to ask for a password or to confirm an unknown host key. If the key is not already trusted, the probe fails cleanly instead of hanging forever. That is exactly what you want unattended. -oConnectTimeout=15 caps how long a stuck connection can block. And the exit code is the whole result: a scheduler or monitoring system reads it as pass or fail. A successful run prints a listing like this:
-rw-r--r--    1 health   health         21 Mar 14 02:10 canary.txt
OK: synthetic SFTP login succeeded
If you prefer a scripting language over a shell batch, the same probe in Python using the Paramiko SSH library is a dozen lines. It gives you finer control over each step. Those steps are to open the transport, authenticate, open an SFTP channel, put and remove the canary, and time it. The Python SFTP basics article shows the Paramiko patterns this reuses.
Reading a Probe Failure
When the probe fails, the way it fails tells you which rung of the ladder broke, and that maps straight onto the health pyramid. Learning to read the failure saves you the first several minutes of every incident:
- Connection refused or timed out — rung one failed. The process is down, the port is closed, or a firewall is blocking the path. This is a reachability failure: check the service is running first.
- Handshake or negotiation error — rung two failed. TLS or SSH could not agree on terms, or a certificate or host key was rejected. This often means an expired certificate or a changed host key, which ties directly into expiry monitoring.
- Authentication failed — rung three failed while the connection itself worked. The credential is wrong, the account is locked, or the server is refusing logins it cannot record because a disk is full. Port open, login refused is the classic disk-full signature.
- Login succeeded but the file operation failed — rung four failed. The path is healthy right up to the last step. That points at a permissions problem, a missing directory, or a disk that filled between login and write.
Because each failure names its layer, a good probe logs not just "FAIL" but how it failed. That means the exit code, the error text, the rung reached. That single habit turns a probe from an alarm bell into a diagnostic tool. It is the same layered thinking the wider troubleshooting failed transfers pillar applies to any transfer problem.
Probes for FTPS and HTTPS
Not every server speaks SFTP, and a good health system probes each protocol you actually offer. For FTPS — FTP wrapped in TLS — the curl tool does a complete login and directory listing in one line:
curl --ftp-ssl --ssl-reqd -sS \
     --user "healthcheck:$PROBE_PW" \
     --connect-timeout 15 \
     "ftp://transfer.example.com/health/" > /dev/null && echo OK || echo FAIL
--ftp-ssl --ssl-reqd forces the control channel to be encrypted and fails if it cannot be. So the probe also confirms TLS is working, not just FTP. Use --ftp-ssl with -k only when you are deliberately testing against a self-signed certificate in a lab. In production you want certificate validation on. A probe that ignores certificate errors will not warn you when the certificate is the problem. For an HTTPS file endpoint the check is even simpler — ask for the health directory and inspect the status code:
code=$(curl -sS -o /dev/null -w "%{http_code}" \
       --connect-timeout 15 \
       "https://transfer.example.com/health/canary.txt")
[ "$code" = "200" ] && echo "OK ($code)" || echo "FAIL ($code)"
Whichever protocols you run, the rule is the same: probe each one separately. A server can be perfectly healthy on SFTP while its FTPS listener is wedged, and only a per-protocol probe will tell you which door is stuck. The tooling here — curl for FTPS and HTTPS, OpenSSH or Paramiko for SFTP — is covered in more depth in curl for file transfer.
Measuring Response Time, Not Just Success
A probe that only reports pass or fail throws away half its value. The same login also measures response time — how long the check took. A login that still succeeds but now takes far longer than usual is an early warning that something is degrading before it fails outright. Timing is nearly free to add. In a shell, wrap the probe and record the elapsed seconds; curl can report its own timings directly:
curl -sS -o /dev/null \
     -w "connect=%{time_connect}s  total=%{time_total}s\n" \
     --connect-timeout 15 \
     "https://transfer.example.com/health/canary.txt"

connect=0.031s  total=0.184s
Record that number every run and you build a baseline. A synthetic login that normally completes in under a second and now takes eight is telling you the server is under strain. It is overloaded, low on memory, or waiting on slow storage. Meanwhile, the pass/fail check is still green. Treat a sustained rise in probe time as its own alert with a gentler threshold than outright failure. This is the readiness signal that catches trouble before the outage.
Watch the trend rather than any single reading. Response times naturally jitter — a probe that usually takes two hundred milliseconds will occasionally take six hundred for reasons that mean nothing. What matters is the shape over an hour or a day: a slow, steady climb that does not come back down. That pattern almost always precedes a capacity problem. Catching it early buys you the luxury of scheduling a fix instead of scrambling through an outage.
How Often to Check
Check frequency is a balance. Too rare, and an outage runs for a long time before you notice. Too frequent, and you generate load, fill logs with probe entries, and risk false alarms from momentary blips. A workable pattern for most transfer servers:
- Cheap reachability checks run often. These are TCP connect, or a service-state query like
sc queryon Windows orsystemctl is-activeon Linux. Every minute or two is fine because they are nearly free. - Full synthetic logins run less often — every few minutes is plenty. They do real work, so pacing them keeps their footprint small and their log entries manageable.
- Response-time trending piggybacks on the synthetic login; you already have the number, so record it every time the deeper probe runs.
Align the frequency with how fast you actually need to react. If a fifteen-minute outage is tolerable, a five-minute synthetic login is more than enough. There is no prize for probing every ten seconds when nobody acts on the result for a quarter of an hour. On Windows, Task Scheduler runs these probes on a schedule; on Linux, cron does the same job. The mechanics of scheduling unattended jobs like these live in Task Scheduler for transfers and cron for transfers.
Alerting Without the Storm
Alert fatigue is the state where alerts arrive so often, or so pointlessly, that people stop reading them. Then they miss the one that mattered. A probe that fires an alert on every single failed check is the fastest route to alert fatigue. Transient blips are normal: a network hiccup, a one-second overload, a routine restart. The cure is to alert on patterns, not on single events.
Three techniques, in order of usefulness:
- Require consecutive failures. Alert only after, say, three checks in a row fail. A single failed probe is noise; three in five minutes is a real problem. This one change eliminates the large majority of false alarms.
- Alert on transitions, not on state. Send one alert when the server goes from healthy to unhealthy, and one when it recovers. Do not send a fresh alert every check while it stays down. A screen full of "still down" messages buries the "recovered" you actually want to see.
- Separate severities. A failed synthetic login is critical — wake someone. A slow-but-succeeding probe is a warning — log it, look at it in the morning. Mixing the two trains people to ignore both.
The deeper craft of alerts that people actually read — routing, escalation, and wording — belongs to the job-monitoring side of the house. See alerting that gets read. The health-side rule is simpler: make every alert mean "a human should do something now," and the alerts will get read.
Gotcha: remember to monitor the monitor. A synthetic login that silently stops running — a broken scheduler, an expired probe key — produces no failures and no alerts. That looks exactly like health. Have the probe write a heartbeat (a timestamp file, a log line) and alert if that heartbeat itself goes stale.
Bringing It Together
A solid liveness setup has three layers. A cheap reachability check runs often. A full synthetic login runs every few minutes with response time recorded. Alerting requires consecutive failures and reports transitions. Together they answer the two questions that matter: "is it reachable?" and "can a real user actually transfer a file?" They answer the second one, which port checks never can.
A scheduled automation client is a natural home for these probes: it already logs in, transfers, and handles retries and notifications. Sysax FTP Automation fits the canary-login pattern well. It schedules scripted transfers over FTP, FTPS, and SFTP and can send email notification on failure. That is exactly what a synthetic-login probe needs to do. From here, feed the probe results into the core metrics and ultimately onto the health dashboard. There, liveness becomes the top tile everything else hangs beneath.
Frequently Asked Questions
Why is a synthetic login better than a simple port check?
What is a canary account and why give it so few rights?
How often should I run a synthetic login?
How do I stop probe failures from flooding me with alerts?
Should the probe measure how long the login takes?
Do I need a separate probe for each protocol?
From the Sysax team: we build secure file transfer software for Windows. Sysax Multi Server is an FTP, FTPS, SFTP, and HTTPS server. Sysax FTP Automation handles scheduled, scripted transfers. Free trials are on the download page.