
Monitoring Storage Growth and Alerting Early
The disk alert fired at four on a Friday. It said 90% used. That is what it had been saying about the big archive volume for most of a year. So it got the usual acknowledgment and the usual shrug. This time it was the partner-facing data volume, and 90% there meant eleven days. Almost every transfer server already has a disk alert. It is set to whatever number someone typed into the monitoring tool years ago. It has two failure modes. On a big, slow-growing volume it fires months before anything needs doing, gets acknowledged, and is quietly ignored from then on. On a small, fast-growing volume it fires with days to spare, after the point at which the fix could have been calm. The alert is measuring the wrong thing. Percent used says how full a volume is; it says nothing about how soon it will be full.
This article replaces that alert with one that measures time, which is what you are actually running out of. It shows how to sample disk usage on a schedule with nothing but built-in tools. It explains how to compute the growth trend from those samples, and alert on days-until-full rather than percent-used. It covers tracking growth per folder so a new growth source is caught while it is small, and running the monthly review that keeps the whole thing honest. It is part of our Storage Growth series and is the operational companion to capacity planning. The wider question of what a healthy transfer server looks like is covered in our server health monitoring series.
Why Percent-Used Alerts Fire at the Wrong Time
Consider two volumes on two servers, both showing 80% used. The first is a 10 TB archive volume that gains 20 GB a month. It has 2 TB free, which at that rate is about a hundred months of runway. An alert at 80% is eight years early. The second is a 500 GB data volume on a busy partner-facing server that gains 50 GB a month. It has 100 GB free, which is two months. If the procurement lead time is eight weeks the alert has fired at the last possible moment. Same percentage, same alert, opposite meanings. The diagram below draws the two side by side.
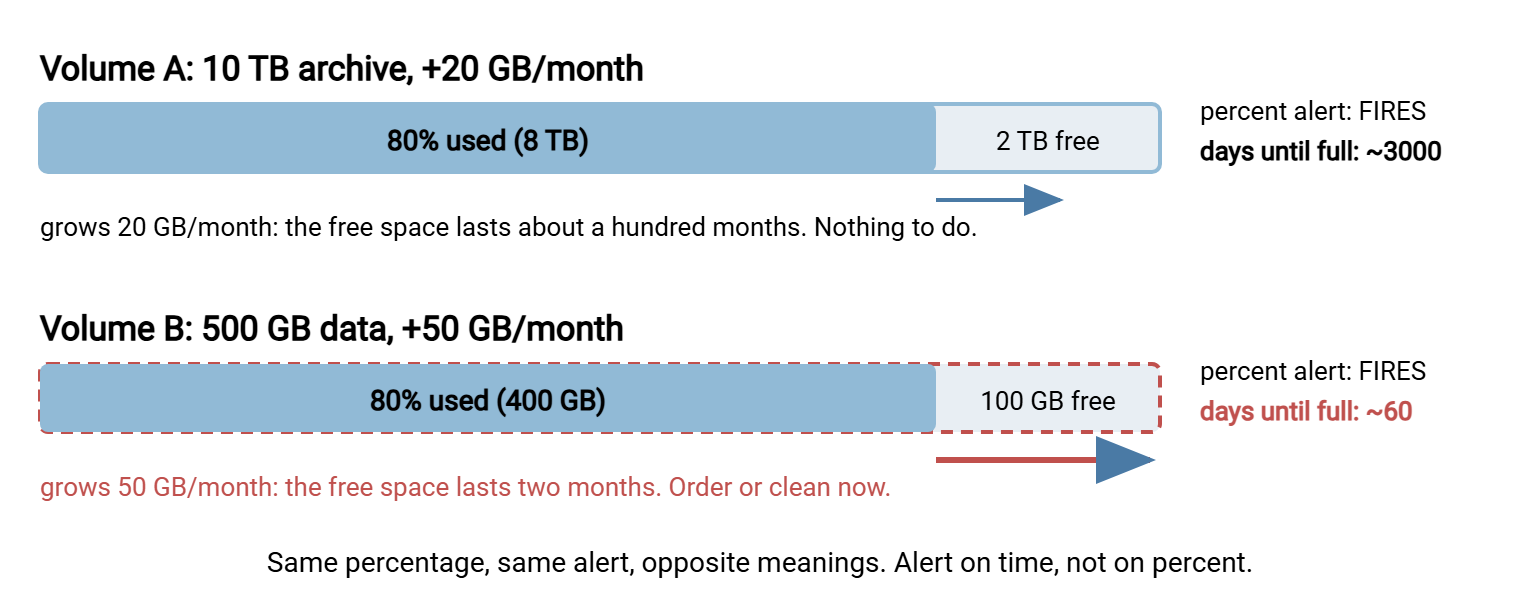
Percent-used is not useless. It is a fine floor. Below some absolute amount of free space, a volume is in danger regardless of trend, because one large upload can finish it. But as the primary alert it produces noise on big volumes and late warnings on small ones. Both teach the people who receive it to stop reading. I have muted one myself, which was the right response to a wrong alert.
Days-Until-Full: The Number Worth Alerting On
Days-until-full is free space divided by daily growth. The growth is a trend. Take the net change in used space over a recent window, typically the last thirty days. Divide that by the days in the window. Thirty days is long enough to smooth out a weekend and a month-end spike, and short enough to notice a new partner within a couple of weeks of onboarding. On the 2 TB example used through this series, used space rose from 1541 GB to 1600 GB over the last thirty days. That is about 2 GB a day. With 400 GB free, days-until-full is 200. Measure to the 85% usable ceiling described in the capacity planning article rather than to 100%. Then the headroom is 100 GB and the number is 50.
Alert on that number with two thresholds. Set a warning when days-until-full drops below your lead time plus a margin. For that threshold, most organizations use somewhere around sixty days. Set a critical alert below thirty. Add the floor. Set a critical alert whenever free space is below a fixed amount, say 5% of the volume or 50 GB, whichever is larger. This applies regardless of trend. And add a third, less obvious alert: a rate spike, fired when the thirty-day growth rate is more than double the ninety-day rate. That one catches the new feed, the debug logging left on, and the looping job, weeks before they show up as a free-space problem. Getting the alert to a person who acts on it is a discipline of its own, and alerting that gets read covers it.
Collecting the Samples
A trend needs history, and history needs a job that records a number every day. A scheduled command appending a line to a text file is all it takes. On Linux, one line in the root crontab samples the data volume every morning at six:
0 6 * * * df -P /srv/transfer | awk -v ts="$(date +\%s)" 'NR==2 {print ts","$6","$2","$3","$4}' >> /var/local/disk-samples.csv
df -P prints one line per volume in kilobyte units. The NR==2 condition skips the header. The fields are the mount point, the size, the used space, and the available space. The timestamp is seconds since the epoch, which looks unfriendly but makes the arithmetic trivial and sorts correctly forever. (The \% is not a typo: cron treats a bare percent sign specially, so it must be escaped inside a crontab.) After two days the file looks like this:
1741910400,/srv/transfer,1953514584,1562811667,390702917
1741996800,/srv/transfer,1953514584,1564902400,388612184
Used space rose by 2090733 KB in 86400 seconds. That is two gigabytes in one day, which is the 60 GB a month you would expect on this volume. Repeat the line for each volume you care about, including the OS volume. Its growth should be nearly zero and its alert is the most important of all. Sample at the same time every day, after the nightly jobs and before the working day. That way, daily variation in in-flight files does not masquerade as growth. On Windows, a scheduled PowerShell script does the same for every fixed drive, in bytes:
$ts = [DateTimeOffset]::UtcNow.ToUnixTimeSeconds()
foreach ($d in Get-PSDrive -PSProvider FileSystem | Where-Object { $_.Used -ne $null }) {
    "$ts,$($d.Name),$($d.Used + $d.Free),$($d.Used),$($d.Free)" | Add-Content C:\ops\disk-samples.csv
}
Run it daily from Task Scheduler as a service account with read access to the volumes and write access to the samples folder. The Task Scheduler for transfers article covers the account and trigger settings. Keep the samples file somewhere that is itself backed up and, ideally, on the log volume rather than the data volume it measures. A year of daily samples for five volumes is well under a megabyte. Nobody will ever ask for budget to store it.
Computing the Trend
With samples on disk, days-until-full is a small script. On Linux, awk reads the last thirty days of rows for one volume, takes the first and last, and divides:
awk -F, -v now="$(date +%s)" -v vol=/srv/transfer '
  $2==vol && $1 >= now-30*86400 { if (!f) { f=$1; u0=$4 } l=$1; u1=$4; sz=$3; fr=$5 }
  END {
    d=(l-f)/86400; if (d < 7) { print vol": not enough samples yet"; exit }
    r=(u1-u0)/d
    if (r <= 0) { print vol": not growing"; exit }
    printf "%s: growth %.1f GB/day, free %.0f GB, days to 100%%: %.0f, days to 85%% ceiling: %.0f\n",
           vol, r/1048576, fr/1048576, fr/r, (0.85*sz-u1)/r
  }' /var/local/disk-samples.csv
/srv/transfer: growth 2.0 GB/day, free 371 GB, days to 100%: 186, days to 85% ceiling: 50
Dividing kilobytes by 1048576 gives gigabytes in binary units. The script refuses to guess from fewer than a week of samples. It reports "not growing" when the volume is flat or shrinking (a cleanup job just ran, or the volume is an outbox that gets emptied). It prints both the naive number and the number against the usable ceiling. The PowerShell version reads the same shape of file:
$vol = 'D'; $window = 30
$now  = [DateTimeOffset]::UtcNow.ToUnixTimeSeconds()
$rows = Import-Csv C:\ops\disk-samples.csv -Header ts,vol,size,used,free |
        Where-Object { $_.vol -eq $vol -and [int64]$_.ts -ge ($now - $window * 86400) }
$first = $rows[0]; $last = $rows[-1]
$days  = ([int64]$last.ts - [int64]$first.ts) / 86400
$rate  = ([int64]$last.used - [int64]$first.used) / $days        # bytes per day
$head  = 0.85 * [int64]$last.size - [int64]$last.used
if ($days -lt 7)    { "${vol}: not enough samples yet" }
elseif ($rate -le 0) { "${vol}: not growing" }
else { "{0}: growth {1:N1} GB/day, days to 85% ceiling {2:N0}" -f $vol, ($rate / 1GB), ($head / $rate) }
The rate-spike alert falls out of the same script. Run it a second time with a ninety-day window (change the 30 to 90, or the $window value). Compare the two growth figures. A thirty-day rate more than double the ninety-day rate means something new started in the last month. That change is worth a look even when days-until-full is still comfortable.
Either script is the alert. Run it daily after the sample is taken, and compare the result with the thresholds. Send a message when a threshold is crossed. If you have a monitoring system, feed it the days-until-full figure as a metric and set the thresholds there (a server health dashboard is its natural home). If you do not, a scheduled script that emails when the number is under sixty is a perfectly respectable alert. Taking first and last samples is deliberately simple. A least-squares line through all thirty points is more robust to a single odd day, and worth doing if you have the tooling. But the simple version catches the same problems a week or two earlier than a percent alert would. That is the point. Elegance can wait; the disk will not.
Remember: a trend alert is only as good as its samples. If the sampling job stops, the trend silently freezes and the alert never fires. The service account's password may have expired, or the server may have been rebuilt. Or the samples file was on the volume that filled. Alert on a stale samples file too: if the newest row is more than two days old, that is a critical alert about the monitoring itself.
Per-Folder Growth Tracking
A volume-level trend tells you when. It does not tell you why, and by the time the volume alert fires, the folder that caused it has been growing for weeks. Sampling the top-level folders nightly answers "why" continuously and catches a new growth source while it is still small. On Linux, extend the cron job to record the size of each partner folder:
15 6 * * * for d in /srv/transfer/partners/* /srv/transfer/archive /srv/transfer/staging; do echo "$(date +\%s),$d,$(du -xsk "$d" | cut -f1)"; done >> /var/local/folder-samples.csv
du -xsk gives one summary line per folder in kilobytes, staying on the volume. The job takes as long as a full du of the tree, so schedule it after the nightly transfers and before the working day. A month later, a short awk turns the samples into a league table of thirty-day growth per folder:
$ awk -F, -v now="$(date +%s)" '$1 >= now-30*86400 { if (!($2 in f)) f[$2]=$3; l[$2]=$3 }
    END { for (d in f) printf "%8.1f GB  %s\n", (l[d]-f[d])/1048576, d }' /var/local/folder-samples.csv | sort -rn | head
    61.2 GB  /srv/transfer/partners/northwind
    18.4 GB  /srv/transfer/partners/acme
     4.0 GB  /srv/transfer/archive
     0.3 GB  /srv/transfer/partners/contoso
    -2.1 GB  /srv/transfer/staging
Read it top down. One partner accounts for most of the volume's growth. That either matches what you expect of them or is the outbox-nobody-collects pattern from why transfer servers fill up. A folder that appears in the table for the first time, or whose thirty-day figure is double what it was last month, is the new growth source. The disk hunt can start there instead of at the top of the tree. Staging going slightly negative is healthy: it means cleanup is keeping up. On Windows, the top-N folder loop from that same article, with the timestamp prepended and the output appended to a file, gives identical data. A graphical disk-usage viewer can show a snapshot, but it cannot show you a trend without the samples. A picture of the volume today is not a trend, however nicely drawn.
Do not forget the log folder in this list. A server that writes activity logs with rollover, as Sysax Multi Server does, produces a folder whose size should be roughly constant once old files are being deleted. A log folder that appears in the growth table is a rollover without a deletion rule, or debug logging that someone forgot to switch off.
Acme's first rate-spike alert fired eleven days after a new supplier went live. Days-until-full still read well over a hundred, so nothing else was complaining. But the thirty-day rate had climbed to two and a half times the ninety-day rate. The per-folder table put the new supplier's inbox at the top. The supplier was sending hourly full snapshots instead of the daily deltas the intake form had promised. The processing job was faithfully archiving every one of them. One phone call changed the schedule. One line added the folder to the archive cleanup rule, and the volume alert never fired at all. The spike alert had been the one everyone argued was unnecessary.
Alert Design That Gets Acted On
The alert message decides whether the fix happens before or after the outage. A message that says "D: is at 87%" prompts a shrug. A message that carries the decision-making numbers prompts a ticket. Include, at minimum:
- The volume and the server, by the names people use, not just a drive letter.
- Free space, the thirty-day growth rate, and days-until-full, both to 100% and to the usable ceiling.
- The three fastest-growing folders from the per-folder samples, with their thirty-day growth, so the reader knows where to look before they open a terminal.
- The suggested action, tied to the threshold: "warning: begin the add-versus-clean decision" or "critical: reclaim space today". A link to the runbook or to this series saves the next person the search.
Two design rules keep the alert credible. First, use different thresholds for raising and clearing. Raise the warning when days-until-full drops below sixty. Clear it only when the number rises above seventy-five. Without that gap, a volume hovering at the threshold sends an alert and a recovery every other day. The alert is muted within a week. Second, route by severity. A warning can go to a ticket queue read during working hours, because by definition there are weeks of runway. A critical alert and the stale-samples alert go to whoever is on call. Quota alerts say a single partner or folder is near its limit rather than that the volume is. They belong alongside these and are covered in the quotas and automated cleanup series, under quota and cleanup monitoring.
The Monthly Review
Alerts catch the volumes that are about to be a problem. The review catches the ones that will be a problem next quarter, and it takes about fifteen minutes per server. Once a month, in a calendar slot that does not move:
- Recompute the trend for every volume, including the OS and log volumes, and compare with last month. Note any rate that changed by more than a quarter in either direction.
- Read the per-folder league table. Name the top three. For each, confirm the growth is expected (a partner sending what they said they would) or open a ticket.
- Look for new entries. A folder that did not exist last month is either a new onboarding with a cleanup rule, or one without. Check which.
- Confirm the cleanup and archive jobs ran. Check their last-run time and their logs. A cleanup job that stopped running is the most common reason a rate doubles, and it is invisible until someone looks. The why jobs fail silently article explains how that happens.
- Update the planning worksheet. Carry the new rate into the runway and order-by calculations from the capacity planning article, and move the order-by date if it changed.
- Test the alert. Lower a threshold temporarily, or run the script against a copy of the samples with a fake row. Then confirm a message arrives where it should. An alert that has never fired is an assumption.
- Check the samples themselves. Are there gaps? Is the newest row from this morning? Is the file backed up?
Write the review's findings in the same document as the worksheet, one short paragraph per month. After six months that document tells the story of the server's growth better than any chart. It is what you hand to whoever approves the next disk. It is also a story the disk cannot argue with.
The Alert You Actually Want
Replace "the volume is 85% full" with "the volume has fifty days of runway to its usable ceiling. It is growing 2 GB a day. Most of that growth is one partner's outbox". The first message is a fact; the second is a decision, and it arrives while the decision is still cheap. Getting there takes a scheduled sample, a short script, two thresholds with a gap between them, and a monthly quarter-hour. Nothing in it needs software you do not already have. The four-on-a-Friday alert can retire.
This article closes the series. If you arrived here first, why transfer servers fill up explains the growth patterns the alerts are detecting. The article capacity planning turns the trend into a purchase date. And archive tiers is the usual answer once the alert has told you which folder is cold.
Frequently Asked Questions
Should I remove my existing percent-used alert?
How many days of samples do I need before the trend is meaningful?
What if the volume shrinks some days and grows others?
Why track individual folders when I already have a volume alert?
My monitoring tool only supports percent thresholds. What can I do?
From the Sysax team: we build secure file transfer software for Windows. Sysax Multi Server is an FTP, FTPS, SFTP, and HTTPS server. Sysax FTP Automation handles scheduled, scripted transfers. Free trials are on the download page.