
Monitoring Quotas and Cleanup Jobs
The cleanup log ends on a perfectly normal line, three weeks back, and nobody has noticed. Quotas and cleanup jobs fail quietly. A quota that rejects a partner's upload at two in the morning says nothing unless something is listening. A cleanup job that stopped running three weeks ago looks exactly like one that is running fine, right up until the volume is full. And a cleanup job that removed ten times its usual haul last night is indistinguishable from a normal run unless someone compares the two numbers. None of these controls is finished until it is watched. A control nobody watches is a hope with a schedule.
This article is about watching them specifically. It covers usage-versus-quota alerts that warn before a rejection rather than after. It explains how a quota hit appears in server and system logs and how to turn a burst of them into an alert. It covers what a cleanup run report should contain and how to detect the cleanup that quietly stopped. It covers the alarm for a cleanup that deleted far too much. It also covers reconciliation — checking that the quotas actually applied match the policy that was written. It closes with the quarterly review that keeps the numbers honest.
It is the last article in our Quotas and Automated Cleanup series. General job monitoring — heartbeats, alert design, dashboards — is covered in depth in our job status monitoring basics series. This article applies those ideas to two particular jobs, one that refuses writes and one that removes files. It does not repeat those ideas.
The Signals, and What Each One Catches
A signal is a measurable fact that changes when something goes wrong. The table lists the signals that matter for quotas and cleanup, where each comes from, and the condition that should raise an alert. It is the policy the rest of the article implements; copy it and adjust the numbers.
| Signal | Source | Alert when | Severity |
|---|---|---|---|
| Usage vs hard limit, per partner | FSRM thresholds, repquota, quota script | Above 80 percent, or under 14 days to full at current growth | Warning, business hours |
| Refused writes, per account | Server log, FSRM or kernel events | Any refusal; more than 5 in 15 minutes from one account | Warning; burst is urgent |
| Cleanup heartbeat | Last-success file, Task Scheduler result | No successful run in 26 hours | Warning, escalate at 50 hours |
| Cleanup volume vs baseline | Cleanup run report | Moved bytes or count above 3 times the 30-day median, or the cap abort fired | Urgent |
| Trash folder size | Folder measurement | Growing for more than 8 days (purge not working) or a sudden jump | Warning |
| Volume free space | OS | Independent of quotas; the backstop | Per storage-growth series |
| Policy vs applied quotas | Reconciliation script | Any drift, missing, or untracked quota | Ticket, weekly |
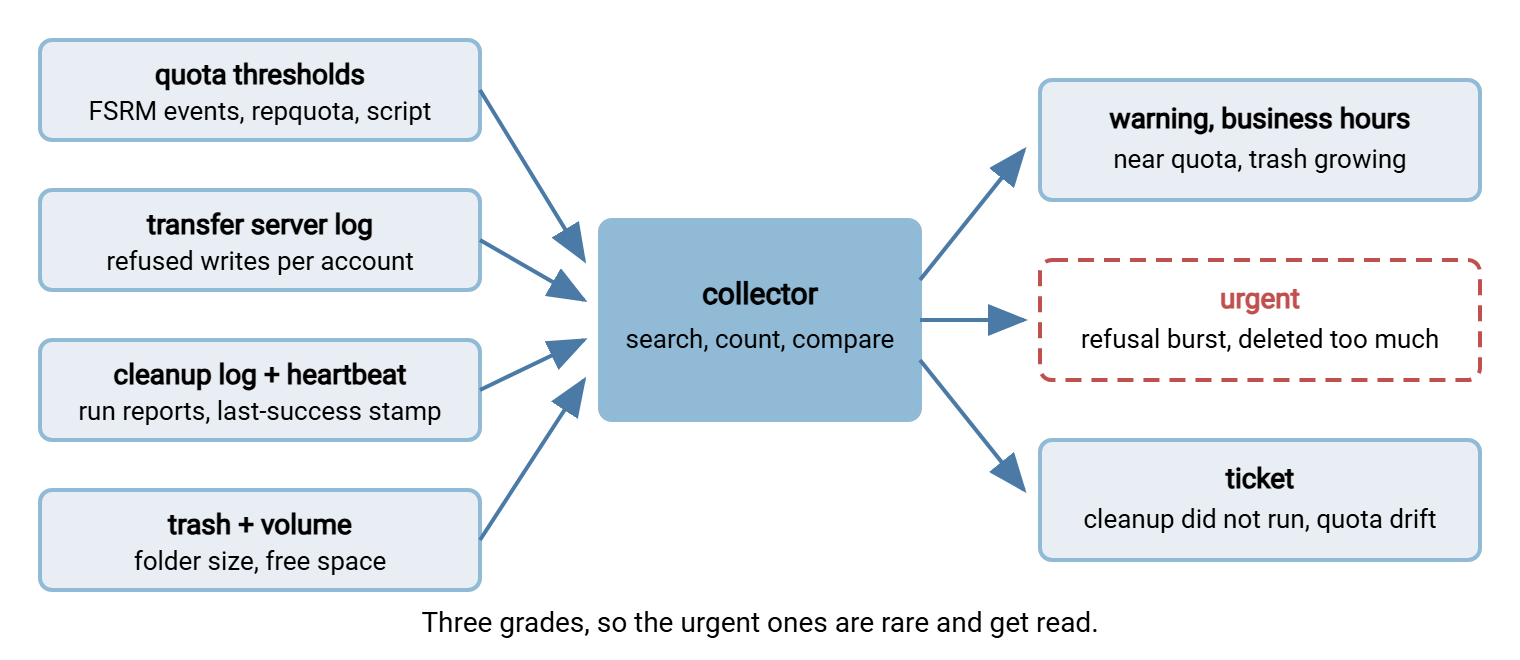
The diagram shows where these signals come from and where they go: four sources feeding one place that searches and counts them, producing three grades of alert.
Near-Quota Alerts That Warn Before Rejection
The purpose of a soft limit is to buy time, and it only does that if the warning reaches someone while there is still time to use. Two kinds of near-quota alert exist, and you want both.
The percentage alert is the simple one: usage crossed 80 percent of the hard limit. On Windows, FSRM thresholds send it by email or write an Application-log event the moment usage crosses the line, with no polling needed. The enforcement article shows how to build them. On Linux, the equivalent is a small scheduled check that parses repquota. This one-liner prints every user above 80 percent of their hard limit. The third and fifth columns are used and hard in kilobytes, and skipping the first five lines drops the header:
# repquota /srv/xfer | awk 'NR>5 && $5+0>0 { pct=int(100*$3/$5); if (pct>=80) printf "%-12s %3d%% of hard (%s of %s KB)\n",$1,pct,$3,$5 }'
northwind     84% of hard (17623040 of 20971520 KB)
The time-to-full alert is the better one. A partner at 84 percent whose usage has been flat for a month is not a problem. A partner at 60 percent growing two percent a day will hit the wall in twenty days. If you keep a daily record of each partner's usage — the same measurement the design article used for sizing — the arithmetic is one line. Days to full equals remaining space divided by the average daily growth over the last week. Alert when that number drops below 14, regardless of the percentage. The same idea applied to the whole volume is the heart of our storage growth series.
Whichever alert fires, its text should say what the reader needs to decide. That means the partner, the percentage, the days-to-full estimate, the hard limit, and the name of the partner contact. "northwind 84 percent, about 6 days to full at current growth, limit 20 GB, contact d.okafor" is a message someone can act on before lunch. Writing alerts people actually read is the subject of alerting that gets read.
Quota-Hit Events in Server Logs
A quota hit is a write the system refused because the limit was reached. It leaves evidence in two places, and monitoring should read both.
The transfer server's own log records the refusal from the protocol's point of view. Over FTP the line is unmistakable, because the reply code names the cause:
Mar 14 02:11:07 [acme] 203.0.113.40 STOR extract_YYYYMMDD.csv
Mar 14 02:11:07 [acme] 203.0.113.40 552 Requested file action aborted. Exceeded storage allocation
Mar 14 02:16:09 [acme] 203.0.113.40 STOR extract_YYYYMMDD.csv
Mar 14 02:16:09 [acme] 203.0.113.40 552 Requested file action aborted. Exceeded storage allocation
Over SFTP the server reports a generic write failure, so the search is for failed uploads rather than a specific code. A server with per-session activity logging, such as Sysax Multi Server, shows the account, the file, and the failure together. That is what makes the count per account possible. Note the five-minute spacing in the example above: that is a partner's job retrying, and it will keep retrying until someone tells it to stop. That is why the alert rule in the table has two levels. Any refusal is worth a warning. More than five from one account in fifteen minutes is urgent, because the partner's job is looping against a wall.
The operating system records the same event from the quota's point of view. On Windows with FSRM, the Application log carries events from the provider SRMSVC; this pulls the most recent ones:
PS> Get-WinEvent -FilterHashtable @{ LogName='Application'; ProviderName='SRMSVC' } -MaxEvents 5 |
        Select-Object -ExpandProperty Message

User EXAMPLE\svc-xfer has exceeded the 80% quota threshold for the quota on
D:\xfer\partners\northwind on server XFER01. The quota limit is 20.00 GB and
16.82 GB currently is in use (84% of limit).
Notice the user named in the event is the service account, not the partner. That is a reminder that FSRM sees the folder, and the server log sees the account. Correlating the two, by path and time, is what turns "a write was refused somewhere" into "acme hit its quota at 02:11 and has been retrying since." The general technique for building alerts from log searches is in alerts from transfer logs. FSRM knows the folder; the server knows the account; neither has been introduced.
Cleanup Job Health: Ran, Skipped, Deleted-N
A cleanup job's log of individual moves is for answering "where did this file go." Monitoring needs something smaller: one run report per execution, with the numbers that show whether the run was normal. The job should write it as its last act, and email it or append it to a report file that a monitor reads. A report that fits on a screen:
CLEANUP RUN REPORT   run-0314-0200-18211   host xfer01
started    Mar 14 02:00:03     finished   Mar 14 02:00:41     status  OK
roots      2 checked, 0 missing, 0 skipped
candidates 41    moved 41    bytes 3.1 GB    skipped-open 1    skipped-temp 3
purged     2 run folders, 2.8 GB freed
baseline   30-day median moved = 38 files, 2.9 GB   ratio 1.08   within normal range
trash      now 9.4 GB across 7 run folders
Every line answers a question the on-call person would otherwise dig for. status is the exit code in words. roots missing is the deleted-inbox check — a root that vanished is a change someone should know about. The skipped counts prove the safety rails are firing. baseline compares this run with recent history, the input to the next section. And trash proves the purge is keeping up. Seven run folders at a seven-day holding period is right; twenty means the purge has stopped.
The other half of cleanup health is the heartbeat: proof that the job ran at all. Log lines cannot provide it, because a job that never starts writes no log lines. The job's last act on success is to touch a stamp file. That is date '+%b %d %H:%M:%S' > /var/run/xfer-cleanup.last on Linux, or the equivalent Set-Content on Windows. An independent monitor alerts when that file is older than 26 hours. On Windows, Task Scheduler also keeps its own record, which a monitor can query:
PS> Get-ScheduledTaskInfo -TaskName "xfer-cleanup" | Select-Object LastTaskResult, NumberOfMissedRuns

LastTaskResult NumberOfMissedRuns
-------------- ------------------
             0                  0
A LastTaskResult of zero is success. Anything else is the exit code the script returned — 2 for the floor abort and 3 for the cap abort, in the scripts from the age-based article. NumberOfMissedRuns above zero means the trigger fired while the machine was off or the task was disabled.
The ways a cleanup job quietly stops are consistent. For example, the service account's password changed and the task fails to log on. Or the task was disabled during an incident and never re-enabled. Or the cron entry lived on a host that was decommissioned. A stale lock from a crashed run may block every new one. An allowlisted path may have been renamed, and the job skips it with a polite log line nobody reads. The heartbeat catches all of them, which is why it is the one signal not to skip. The broader pattern is in why jobs fail silently, and making sure the monitor itself is alive is monitoring the monitoring. I have met every item on that list, two of them on the same server.
Acme's nightly cleanup stopped on the day the service account's password was rotated and the scheduled task could no longer log on. The log file showed nothing wrong, because a task that cannot start writes no log lines. The volume had enough headroom that the free-space alert stayed quiet. What fired was the heartbeat: the next morning the stamp file was twenty-seven hours old, and the warning went out. The fix was a new password on the task and one line added to the rotation procedure. Nobody would have opened that log for another month.
Remember: a cleanup job has two failure directions, and they need different alarms. Not running is caught by the heartbeat. Running too well — removing far more than usual — is caught by the baseline comparison. A job with only one of the two alarms is half-monitored.
The "Cleanup Deleted Too Much" Alarm
The most expensive cleanup failure is not the one that stops. It is the one that runs against the wrong folder, or after a clock jump, or right after a restore. It removes a month of files in forty seconds. Two layers catch it.
The first layer is inside the job: the candidate cap from the age-based article, which aborts before anything moves when the count is far above normal. When it fires, the job exits with a distinct code and the run report says status ABORT-CAP. That must be an urgent alert, not a warning, because a cap abort means the job's view of the world changed. Until someone finds out why, the next run will abort too, and nothing is being cleaned.
The second layer is outside the job, in the monitor that reads run reports. Compare this run's moved bytes and count with the 30-day median, and alert urgently when the ratio exceeds three. This catches what the cap cannot — a run that was under the cap but still far above normal. One example is a partner folder that was correctly pointed at but whose files were mis-timestamped by a restore. The response is mechanical because of the trash design. The on-call person reads the run's MOVED lines, decides whether the files should come back, and moves the run folder's contents back in one command. That is the whole reason the holding period exists.
Watch the trash folder's size as a third, independent hint. A sudden jump is a big run. Steady growth past eight days means the purge phase has stopped and the volume will fill from the trash side instead. (The volume-level alerts that catch that are in storage growth monitoring and alerts.) Trash is still data as far as the disk is concerned.
Reconciliation: Policy Versus Reality
Reconciliation means checking that two records that should agree actually do. For quotas there are three pairs worth checking, and a weekly script handles all of them.
- Policy versus applied. Every partner in the policy file should have a quota, at the policy's number. Every quota on disk should correspond to a partner in the policy. Drift here is how an expired exception stays raised forever and how a departed partner keeps a 40 GB reservation.
- Applied versus measured. The quota system's idea of usage should match what a folder measurement reports. A large gap on Windows usually means FSRM's usage figure needs a rescan; on Linux it means
quotacheckis due. - Sum of limits versus volume. The overcommit ratio, recomputed, because every exception and every new partner changes it.
The first check is the one that finds real problems most often. On Windows with FSRM it is a short comparison of the policy file with Get-FsrmQuota:
$policy  = Import-Csv "D:\xfer\admin\quota-policy.csv"      # partner,soft_gb,hard_gb
$applied = Get-FsrmQuota | Where-Object Path -like "D:\xfer\partners\*"

foreach ($row in $policy) {
    $q = $applied | Where-Object Path -eq "D:\xfer\partners\$($row.partner)"
    if (-not $q) { "MISSING   no quota on D:\xfer\partners\$($row.partner)"; continue }
    $hardGB = [math]::Round($q.Size / 1GB)
    if ($hardGB -ne [int]$row.hard_gb) { "DRIFT     $($row.partner): policy $($row.hard_gb) GB, applied $hardGB GB" }
}
$applied | Where-Object { (Split-Path $_.Path -Leaf) -notin $policy.partner } |
    ForEach-Object { "UNTRACKED quota on $($_.Path) not in policy" }

DRIFT     acme: policy 40 GB, applied 120 GB
MISSING   no quota on D:\xfer\partners\globex
UNTRACKED quota on D:\xfer\partners\oldpartner not in policy
Each line of that output is a ticket. The DRIFT on acme is an exception that expired and was never reverted — the exceptions register should show it. The MISSING quota on globex means a partner was onboarded without one, or the auto-apply rule is not working. The UNTRACKED quota is a partner who was offboarded from the policy but not from the server. On Linux, the same comparison reads repquota instead; the shape is identical. Reports like this, run automatically and kept, are also what auditors like to see — see reports worth automating. The server never gets the offboarding memo unless a script delivers it.
The Quarterly Quota Review
Alerts handle the exceptional day. The review handles slow drift. That includes the partner whose volume doubled over a year, the exception that became permanent, the cleanup baseline that crept up because a collector broke. Once a quarter, with the numbers in front of you, walk this list:
QUARTERLY QUOTA AND CLEANUP REVIEW
[ ] Threshold history: which partners crossed 80% and how often. Never = too generous; weekly = too tight.
[ ] Refused writes: any partner that hit its hard limit, and whether the cause was fixed at the source.
[ ] Exceptions register: every entry has an expiry; expired ones reverted; anything renewed twice becomes policy.
[ ] Reconciliation: last four weekly reports show zero DRIFT, MISSING, UNTRACKED.
[ ] Overcommit ratio: sum of hard limits divided by volume size, and whether it moved.
[ ] Right-sizing: partners under 10% of their limit for the quarter (shrink) and over 60% typical (grow).
[ ] Cleanup baseline: 30-day median moved per run, compared with last quarter, with an explanation for any change.
[ ] Cleanup aborts: every ABORT-CAP or floor abort in the quarter, and what caused it.
[ ] Heartbeat gaps: any day with no successful cleanup run, and why.
[ ] Trash: purge keeping the holding period; no run folder older than the period.
[ ] Alert routing: every alert in the signal table still reaches a person who is still on the team.
[ ] Policy document updated with anything the above changed.
The right-sizing line is where the review pays for itself. Quotas are set from measurements that go stale. A partner sized at 40 GB two years ago may now peak at 4 GB or at 34 GB. Either way, the number is wrong. Re-run the sizing arithmetic from designing quota policies against the quarter's data. Change the numbers through the same announce-then-enforce process as the first time. A quota set from stale data is a guess with a date on it.
Wrapping Up
Quotas and cleanup jobs are only controls if they are watched. Near-quota alerts should warn on time-to-full, not just percentage, and say enough for someone to act. Quota hits show up in the server log as refused writes and in the OS as threshold events. A burst from one account is a looping partner job and is urgent. A cleanup job needs a run report with a baseline comparison and a heartbeat that proves it ran. It needs an urgent alarm — cap abort or baseline ratio — for the night it removes far too much. Reconciliation catches the expired exception and the forgotten partner. The quarterly review catches everything that drifts too slowly for an alert.
That completes the series. If you are building from scratch, start with quotas as an operational control for the concepts. In that case, apply them with enforcing quotas. Then keep usage under the limits with age-based cleanup jobs that do not bite. For the wider view of a healthy transfer server — disk, sessions, certificates, logs — see our server health monitoring series. The log from the first paragraph now has something watching for it to stop.
Frequently Asked Questions
Why alert on days-to-full instead of a percentage?
How do I know a quota was actually hit, not just approached?
What is a heartbeat, and why does a cleanup job need one?
How do I detect a cleanup that deleted far too much?
What does quota reconciliation check?
From the Sysax team: we build secure file transfer software for Windows. Sysax Multi Server is an FTP, FTPS, SFTP, and HTTPS server. Sysax FTP Automation handles scheduled, scripted transfers. Free trials are on the download page.