
Measuring What Users Actually Feel
Ticket 4471: "The portal is slow." Attached to the same server, in the same week, a benchmark report: a hundred megabytes a second. Both are true at the same moment, about the same machine. The gap between them is the most common failure of transfer benchmarking: measuring a rate when people experience waits. A user uploading a twenty megabyte report does not feel throughput. They feel the four seconds before the login prompt and the six seconds before the folder appears. They feel the fifteen minutes before the system on the other side notices the file. They call all of that "the transfer."
This article defines the metrics that match what people actually experience. It shows a small script that measures them from where users sit and lists the places felt time usually hides. It also explains how to set targets in words a manager or a partner recognizes. It is part of our Benchmarking Transfer Performance series. It complements the earlier articles on why most transfer benchmarks lie and designing a transfer benchmark. Those articles build the throughput instrument. This one builds the other instrument.
Throughput Is a Rate; People Feel Waits
Throughput is bytes per second during the data phase of a transfer. It is the right number for capacity planning and the wrong number for satisfaction. That is because the data phase is a small part of what a person waits through. And a person's sense of "slow" is set by the longest pause, not by the average rate.
Consider what a throughput benchmark hides. A two-second delay before the login prompt is invisible inside a two-gigabyte test that takes twenty seconds. It is two-thirds of the experience of uploading a small report. A directory listing that takes six seconds never appears in a throughput figure at all, because listings move no file data. Take a downstream job that polls its inbox every fifteen minutes. That adds, on average, seven and a half minutes to the time between "I uploaded it" and "they have it." No benchmark of the server will ever see it. The user sees every one of those, and adds them up. The user is good at adding.
The diagram below follows one ordinary upload, a twenty megabyte report through a web portal. It compares what the throughput benchmark measured with what the person at the keyboard waited through.
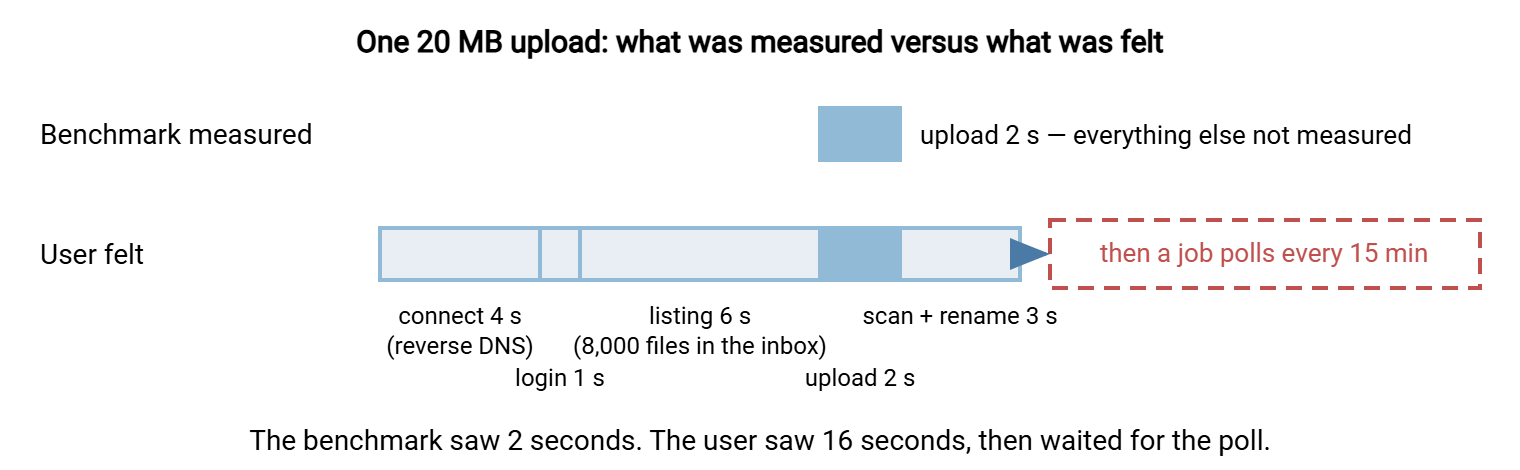
Sixteen seconds of waiting, two of which were the transfer, and then an open-ended wait for another system. Doubling the server's throughput would turn sixteen seconds into fifteen. Fixing the connect delay and the listing would turn it into six, without touching a single byte per second.
The Metrics That Match Experience
Each of the following is a wall-clock duration a person could measure with a stopwatch. That is the test of whether a metric matches experience. Define them once, measure them the same way every time, and report them in seconds and minutes rather than rates.
- Time to connect. It runs from the click or the command to "connected and logged in." It includes name resolution, the TCP connection, the TLS or SSH handshake, authentication, and any lookups the server performs before it answers. This is the wait that makes a server feel slow before it has moved anything.
- Time to first byte. From the request to the first byte of the response: the standard web measure, and the right one for portal pages and downloads. It captures everything the server does before it starts sending: locating the file, checking permissions, opening it.
- Time to listing. From opening a folder to seeing its contents. Listings move no file data, so throughput benchmarks never see them. An inbox with thousands of files can take many seconds to list over any protocol.
- Completion time for their file mix. It runs from the start of the job to the last file being usable at the far end. It includes renames from temporary names, verification, and notification. This is for the files that person or partner actually moves, not for a test file. This is the metric a partner means by "how long does the feed take."
- Time to arrival. From the moment a file exists upstream to the moment the consumer can use it. It includes the scheduler's wait, the settle checks that hold a file until it stops growing, and the downstream poll. Those are the parts of the delay nobody owns and everybody feels.
- Portal responsiveness. This includes page load time and the delay between clicking "upload" and seeing progress. It also includes the pause after the progress bar reaches the end while the server scans, renames, or records the file. That last pause is where users click twice and upload duplicates.
- Retry time. A transfer that fails and succeeds on the second attempt took the time of both attempts plus the wait between them, from the user's point of view. Count it in the felt time, not as a separate reliability statistic.
- Variability. People remember the worst case. A job that "usually takes two minutes, sometimes twenty" is experienced as unreliable. Reporting only the median hides exactly the runs that generate tickets. Report the typical value and the slowest of every ten, in plain words.
Remember: if a metric cannot be measured with a stopwatch by the person who complained, it does not describe what they felt. Seconds to connect, seconds to list, minutes to arrive, not megabytes per second.
A Small Measurement Script
None of these metrics need special tooling. A short script is enough. It runs a few probe operations from where the users are, times each with the shell's clock, and appends one line to a file. Running it every fifteen minutes for a week produces a picture no single benchmark can. The probe should be small and cheap, so that it can run all day without becoming the load it measures.
#!/bin/bash
# felt-time probe: run from the office network or the partner's side, not the server room
HOST=files.example.net
LOG=felt_times.csv
STAMP=$(date +%H:%M)

# 1. HTTPS portal: connect, TLS handshake done, first byte, total — for a small file
read C T F TOT < <(curl -o /dev/null -s \
  -w "%{time_connect} %{time_appconnect} %{time_starttransfer} %{time_total}" \
  https://$HOST/portal/probe_YYYYMMDD.txt)

# 2. SFTP: connect + login + listing only (batch file holds: ls /inbox, then quit)
S=$(date +%s.%N); sftp -b list_only.txt probe@$HOST > /dev/null; E=$(date +%s.%N)
LIST=$(echo "$E - $S" | bc)

# 3. SFTP: the typical user upload, one 20 MB file, whole job including rename
S=$(date +%s.%N); sftp -b upload_20mb.txt probe@$HOST > /dev/null; E=$(date +%s.%N)
UP=$(echo "$E - $S" | bc)

echo "$STAMP,$C,$T,$F,$TOT,$LIST,$UP" >> $LOG
The first block uses curl's own timing variables. Here, time_connect is the TCP connection. The variable time_appconnect is the moment the TLS handshake completed. Then time_starttransfer is the first byte, and time_total is the end. The difference between the first two is the handshake cost; the difference between the second and third is the server's thinking time. The SFTP blocks time whole batches with the shell's clock. That is because a batch that only lists is a clean measure of connect-plus-login-plus-listing. A batch that uploads one typical file is a clean measure of the user's job. On Windows, the same probe wraps each call in Measure-Command and appends with Add-Content. More curl timing tricks are in our curl for file transfer guide.
Two rules make the probe honest. Run it from where the people are (the office network, the VPN, the partner's side if they will host a script). A probe from the server room measures a network nobody uses. And run it on a schedule rather than by hand. That way it captures the busy hour, the backup window, and the moment the VPN concentrator hiccups. What the busy hour does to a server is its own subject, covered in handling burst load. A scheduled task in Sysax FTP Automation can carry the transfer probe on its own timetable, using the same connection profile every time. It can send an email notification if a run fails outright. That failure is itself a felt-time event worth knowing about.
The server keeps the other half of the record. A transfer server that logs each session and transfer with timestamps lets you compute two things for real users rather than probes. One is the time from login to the completion of their first transfer. The other is the size of the listing they asked for. Sysax Multi Server writes its activity log to a file or a database. Reading those fields is the subject of our guide to reading transfer logs.
Where the Felt Time Hides
When the probe shows a wait that the throughput benchmark never saw, it is almost always in one of these places. They are worth checking in order, because the first three are fixed in minutes. (If the wait is in the transfer itself, that is a different hunt, and slow transfer triage is where it starts.)
- Reverse name lookups on connect. A server that looks up the client's name before answering, on a network where that lookup times out, adds several seconds to every login. Time the login alone; if it is over a second on a LAN, look here first.
- Oversized listings. An inbox or archive folder holding thousands of files takes seconds to list, and every client lists on login. Archive or purge on a schedule; keep working folders small. Our guide to automated purge policies covers the mechanism.
- The scheduler's interval. A downstream job polling every fifteen minutes adds up to fifteen minutes to arrival, and the average person waits half of it. Shorten the interval or move to an event-driven trigger; see detecting new files.
- Settle checks and stability waits. A watch folder that waits for a file to stop growing before processing adds its settle time to every arrival. The wait is usually right; it is just invisible to a throughput benchmark. The design is covered in arrival contracts and debouncing.
- Post-transfer processing. Antivirus scanning, checksum verification, decryption, and renaming happen after the last byte and before the file is usable. Each is seconds; together they are the pause at the end of the progress bar.
- Retries. A job that fails once and succeeds on retry after a two-minute backoff took two minutes longer than any benchmark predicts. Count the retries per week in the probe log; our article on retry strategies and backoff explains why the wait is there.
- The path from the user. A VPN, a proxy, a wireless link, a laptop with a full disk. The probe from the office catches these; the benchmark from the server room never can. Path and middlebox slowdowns is the guide to the boxes in between.
- Multi-factor prompts and expired sessions. A session that times out during a long listing and asks the user to authenticate again is felt as "the server dropped me." Note it in the probe log when a run needs a second login.
Inboxes deserve a word of their own, because item two is the one I meet most often. Nobody archives an inbox. It archives itself, on the day the disk fills. Until then it grows a few hundred files a week and adds a few milliseconds to every listing. It happens so slowly that no single day is the day it became a problem.
Setting Targets in Terms People Recognize
A performance target that says "50 megabytes per second" cannot be checked by the person it is meant to satisfy. A target that says "a twenty megabyte report uploads from the office in under fifteen seconds" can be checked with a wristwatch. It can be argued about honestly and reported against every week. Write targets as the felt metric, the situation, and a number in seconds or a clock time. Write two numbers where variability matters: what it should usually be, and what it must never exceed more than one time in ten.
| Situation | Felt metric | Example target | How it is measured |
|---|---|---|---|
| Anyone logging in from the office | Time to connect | Under 2 seconds usually; never over 5 more than once in ten | Probe: login-only batch, every 15 minutes |
| Analyst opening the inbox | Time to listing | Under 2 seconds | Probe: listing batch; folder size from the server log |
| Office user uploading a 20 MB report | Completion time, click to "done" | Under 15 seconds usually; under 30 worst case in ten | Probe: 20 MB upload batch from the office network |
| Partner's nightly feed | Time to arrival against a cutoff | Complete and visible by 06:00 every day | Server log timestamp of the last file versus the cutoff |
| Downstream system waiting for a file | Arrival to pickup | Under 5 minutes | Arrival timestamp versus the processing log |
| Remote user downloading a 2 GB archive | Completion time | Under 5 minutes on the office link | Timed download from the user's location, monthly |
Three habits keep targets honest. Tie each to a real situation and a real place. That is because "under two seconds" means nothing without "from the office" or "from the partner's network." Set the number where a person would notice the difference, not where the hardware could reach. A listing target of half a second is not a better target than two seconds. It is one that costs money to hit and that nobody would perceive. I set one once; it cost a storage upgrade, and the analysts noticed nothing at all. And derive deadline targets from the business cutoffs they serve, so that "by 06:00" has a reason behind it. Our articles on cutoff times and deadlines and partner SLAs and expectations show where those numbers come from.
Rule of thumb: a target is well written when it meets two conditions. The person who complained could check it with a wristwatch. The person who owns the server could explain why it is achievable. "Usually under X, never over Y more than once in ten" is the shape that satisfies both.
Closing the Gap: A Worked Example
Return to the upload from the diagram; it was Meridian Parts' internal portal. The server benchmarked at a hundred megabytes a second on the LAN, and the tickets kept coming. The probe, run from the office every fifteen minutes for three days, told a different story from the benchmark. Time to connect was four seconds, time to listing six seconds, upload two seconds, post-processing three. And a downstream job picked files up on a fifteen-minute poll. Typical time from click to "the file has been processed" was eight minutes; the worst case in ten was sixteen.
Nothing about the transfer needed fixing. The four-second connect was a reverse name lookup timing out. It was a server setting, changed in a minute. The connect dropped to a third of a second. The six-second listing was an inbox holding eight thousand processed files that nobody had archived. A nightly purge to an archive folder brought it to two hundred files and half a second. The fifteen-minute poll became a one-minute poll on the downstream job, with an event-driven trigger planned for later. After the changes, the probe showed a typical click-to-processed time of just over one minute, and the worst case in ten of about two. That was down from eight minutes and sixteen, with the throughput figure unchanged to the byte. Ticket 4471 was closed with a one-line note, which is the best kind.
That is the general shape of user-felt performance work. The benchmark was right about the thing it measured. The users were right about the thing they felt. The fixes were in the parts of the path that no throughput test can see. Watching the felt metrics continuously is how you find the next one before it becomes a ticket. Do this alongside the job-status monitoring described in our freshness checks article.
Two Instruments, One Server
A transfer server needs two kinds of measurement. The throughput benchmark, built in the earlier articles of this series, tells you what the hardware and the protocol can do. It catches the day they stop doing it. The felt-time probe, built here, tells you what people are waiting for. It measures seconds to connect, seconds to list, minutes to arrive, the worst case in ten. The two disagree constantly, and the disagreement is the finding. It points at the reverse lookup, the swollen inbox, the polling interval, the settle wait, the retry, the VPN.
Both instruments produce numbers that are only useful if they are kept, compared, and re-run after every change. Reporting results and catching regressions is where the probe's log and the benchmark's run log become a baseline and an alarm. If the felt metrics point at the transfer itself rather than the waits around it, the tuning knobs worth benchmarking is the next stop. And if you want a dashboard people will actually look at, our guide to transfer dashboards and reporting is built around exactly these plain-words numbers.
Frequently Asked Questions
The benchmark is fast but users say the server is slow. Who is right?
What is time to first byte, and why does it matter for file transfer?
Why does logging in take several seconds on a fast LAN?
Should targets be set as averages?
Where should the felt-time probe run?
From the Sysax team: we build secure file transfer software for Windows. Sysax Multi Server is an FTP, FTPS, SFTP, and HTTPS server. Sysax FTP Automation handles scheduled, scripted transfers. Free trials are on the download page.